Guobang Pharma Ltd. (SHSE:605507) Stock Is Going Strong But Fundamentals Look Uncertain: What Lies Ahead ?


Guobang Pharma's (SHSE:605507) stock is up by a considerable 15% over the past three months. But the company's key financial indicators appear to be differing across the board and that makes us question whether or not the company's current share price momentum can be maintained. Specifically, we decided to study Guobang Pharma's ROE in this article.
ROE or return on equity is a useful tool to assess how effectively a company can generate returns on the investment it received from its shareholders. Put another way, it reveals the company's success at turning shareholder investments into profits.
View our latest analysis for Guobang Pharma
How Do You Calculate Return On Equity?
ROE can be calculated by using the formula:
Return on Equity = Net Profit (from continuing operations) ÷ Shareholders' Equity
So, based on the above formula, the ROE for Guobang Pharma is:
8.7% = CN¥657m ÷ CN¥7.6b (Based on the trailing twelve months to June 2024).
The 'return' refers to a company's earnings over the last year. So, this means that for every CN¥1 of its shareholder's investments, the company generates a profit of CN¥0.09.
What Is The Relationship Between ROE And Earnings Growth?
Thus far, we have learned that ROE measures how efficiently a company is generating its profits. We now need to evaluate how much profit the company reinvests or "retains" for future growth which then gives us an idea about the growth potential of the company. Generally speaking, other things being equal, firms with a high return on equity and profit retention, have a higher growth rate than firms that don’t share these attributes.
Guobang Pharma's Earnings Growth And 8.7% ROE
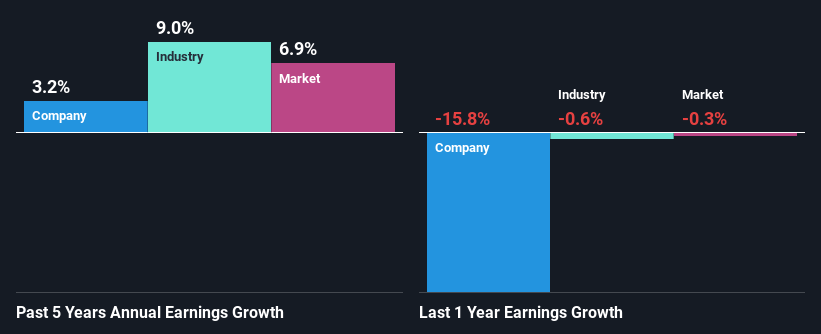
When you first look at it, Guobang Pharma's ROE doesn't look that attractive. Yet, a closer study shows that the company's ROE is similar to the industry average of 7.6%. We can see that Guobang Pharma has grown at a five year net income growth average rate of 3.2%, which is a bit on the lower side. Remember, the company's ROE is not particularly great to begin with. Hence, this does provide some context to low earnings growth seen by the company.
We then compared Guobang Pharma's net income growth with the industry and found that the company's growth figure is lower than the average industry growth rate of 9.0% in the same 5-year period, which is a bit concerning.
Earnings growth is an important metric to consider when valuing a stock. It’s important for an investor to know whether the market has priced in the company's expected earnings growth (or decline). This then helps them determine if the stock is placed for a bright or bleak future. If you're wondering about Guobang Pharma's's valuation, check out this gauge of its price-to-earnings ratio, as compared to its industry.
Is Guobang Pharma Efficiently Re-investing Its Profits?
While Guobang Pharma has a decent three-year median payout ratio of 36% (or a retention ratio of 64%), it has seen very little growth in earnings. So there could be some other explanation in that regard. For instance, the company's business may be deteriorating.
In addition, Guobang Pharma has been paying dividends over a period of three years suggesting that keeping up dividend payments is way more important to the management even if it comes at the cost of business growth.
Conclusion
Overall, we have mixed feelings about Guobang Pharma. Even though it appears to be retaining most of its profits, given the low ROE, investors may not be benefitting from all that reinvestment after all. The low earnings growth suggests our theory correct. Having said that, looking at the current analyst estimates, we found that the company's earnings are expected to gain momentum. Are these analysts expectations based on the broad expectations for the industry, or on the company's fundamentals? Click here to be taken to our analyst's forecasts page for the company.
New: Manage All Your Stock Portfolios in One Place
We've created the ultimate portfolio companion for stock investors, and it's free.
• Connect an unlimited number of Portfolios and see your total in one currency
• Be alerted to new Warning Signs or Risks via email or mobile
• Track the Fair Value of your stocks
Have feedback on this article? Concerned about the content? Get in touch with us directly. Alternatively, email editorial-team (at) simplywallst.com.
This article by Simply Wall St is general in nature. We provide commentary based on historical data and analyst forecasts only using an unbiased methodology and our articles are not intended to be financial advice. It does not constitute a recommendation to buy or sell any stock, and does not take account of your objectives, or your financial situation. We aim to bring you long-term focused analysis driven by fundamental data. Note that our analysis may not factor in the latest price-sensitive company announcements or qualitative material. Simply Wall St has no position in any stocks mentioned.
About SHSE:605507
Guobang Pharma
Engages in the research, development, production, and sale of products in the pharmaceutical and veterinary industries.
Flawless balance sheet and undervalued.

