Are Strong Financial Prospects The Force That Is Driving The Momentum In Joincare Pharmaceutical Group Industry Co.,Ltd.'s SHSE:600380) Stock?


Joincare Pharmaceutical Group IndustryLtd (SHSE:600380) has had a great run on the share market with its stock up by a significant 20% over the last month. Given that the market rewards strong financials in the long-term, we wonder if that is the case in this instance. Particularly, we will be paying attention to Joincare Pharmaceutical Group IndustryLtd's ROE today.
Return on equity or ROE is a key measure used to assess how efficiently a company's management is utilizing the company's capital. Put another way, it reveals the company's success at turning shareholder investments into profits.
See our latest analysis for Joincare Pharmaceutical Group IndustryLtd
How To Calculate Return On Equity?
Return on equity can be calculated by using the formula:
Return on Equity = Net Profit (from continuing operations) ÷ Shareholders' Equity
So, based on the above formula, the ROE for Joincare Pharmaceutical Group IndustryLtd is:
13% = CN¥2.9b ÷ CN¥23b (Based on the trailing twelve months to June 2024).
The 'return' is the amount earned after tax over the last twelve months. One way to conceptualize this is that for each CN¥1 of shareholders' capital it has, the company made CN¥0.13 in profit.
What Has ROE Got To Do With Earnings Growth?
We have already established that ROE serves as an efficient profit-generating gauge for a company's future earnings. We now need to evaluate how much profit the company reinvests or "retains" for future growth which then gives us an idea about the growth potential of the company. Assuming all else is equal, companies that have both a higher return on equity and higher profit retention are usually the ones that have a higher growth rate when compared to companies that don't have the same features.
Joincare Pharmaceutical Group IndustryLtd's Earnings Growth And 13% ROE
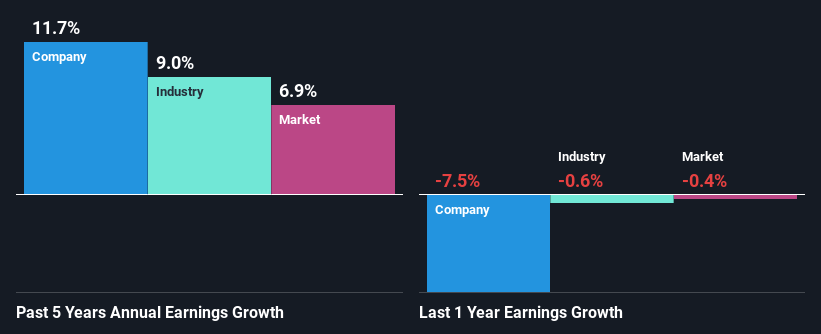
To begin with, Joincare Pharmaceutical Group IndustryLtd seems to have a respectable ROE. Further, the company's ROE compares quite favorably to the industry average of 7.6%. Probably as a result of this, Joincare Pharmaceutical Group IndustryLtd was able to see a decent growth of 12% over the last five years.
Next, on comparing with the industry net income growth, we found that Joincare Pharmaceutical Group IndustryLtd's growth is quite high when compared to the industry average growth of 9.0% in the same period, which is great to see.
The basis for attaching value to a company is, to a great extent, tied to its earnings growth. What investors need to determine next is if the expected earnings growth, or the lack of it, is already built into the share price. This then helps them determine if the stock is placed for a bright or bleak future. Is Joincare Pharmaceutical Group IndustryLtd fairly valued compared to other companies? These 3 valuation measures might help you decide.
Is Joincare Pharmaceutical Group IndustryLtd Efficiently Re-investing Its Profits?
Joincare Pharmaceutical Group IndustryLtd's three-year median payout ratio to shareholders is 23% (implying that it retains 77% of its income), which is on the lower side, so it seems like the management is reinvesting profits heavily to grow its business.
Moreover, Joincare Pharmaceutical Group IndustryLtd is determined to keep sharing its profits with shareholders which we infer from its long history of paying a dividend for at least ten years.
Conclusion
In total, we are pretty happy with Joincare Pharmaceutical Group IndustryLtd's performance. In particular, it's great to see that the company is investing heavily into its business and along with a high rate of return, that has resulted in a sizeable growth in its earnings. On studying current analyst estimates, we found that analysts expect the company to continue its recent growth streak. To know more about the latest analysts predictions for the company, check out this visualization of analyst forecasts for the company.
New: Manage All Your Stock Portfolios in One Place
We've created the ultimate portfolio companion for stock investors, and it's free.
• Connect an unlimited number of Portfolios and see your total in one currency
• Be alerted to new Warning Signs or Risks via email or mobile
• Track the Fair Value of your stocks
Have feedback on this article? Concerned about the content? Get in touch with us directly. Alternatively, email editorial-team (at) simplywallst.com.
This article by Simply Wall St is general in nature. We provide commentary based on historical data and analyst forecasts only using an unbiased methodology and our articles are not intended to be financial advice. It does not constitute a recommendation to buy or sell any stock, and does not take account of your objectives, or your financial situation. We aim to bring you long-term focused analysis driven by fundamental data. Note that our analysis may not factor in the latest price-sensitive company announcements or qualitative material. Simply Wall St has no position in any stocks mentioned.
About SHSE:600380
Joincare Pharmaceutical Group IndustryLtd
Joincare Pharmaceutical Group Industry Co.,Ltd.
Undervalued with excellent balance sheet and pays a dividend.

