
Advertisement
Zhewen Interactive Group (SHSE:600986) Will Be Hoping To Turn Its Returns On Capital Around
What financial metrics can indicate to us that a company is maturing or even in decline? Typically, we'll see the trend of both return on capital employed (ROCE) declining and this usually coincides with a decreasing amount of capital employed. This combination can tell you that not only is the company investing less, it's earning less on what it does invest. On that note, looking into Zhewen Interactive Group (SHSE:600986), we weren't too upbeat about how things were going.
What Is Return On Capital Employed (ROCE)?
Just to clarify if you're unsure, ROCE is a metric for evaluating how much pre-tax income (in percentage terms) a company earns on the capital invested in its business. The formula for this calculation on Zhewen Interactive Group is:
Return on Capital Employed = Earnings Before Interest and Tax (EBIT) ÷ (Total Assets - Current Liabilities)
0.022 = CN¥110m ÷ (CN¥8.3b - CN¥3.3b) (Based on the trailing twelve months to September 2023).
So, Zhewen Interactive Group has an ROCE of 2.2%. In absolute terms, that's a low return and it also under-performs the Media industry average of 4.9%.
Check out our latest analysis for Zhewen Interactive Group
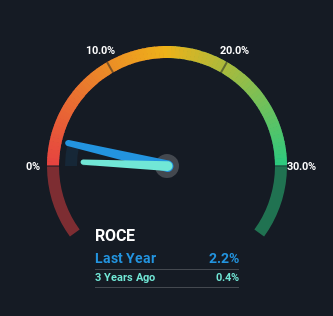
Above you can see how the current ROCE for Zhewen Interactive Group compares to its prior returns on capital, but there's only so much you can tell from the past. If you're interested, you can view the analysts predictions in our free analyst report for Zhewen Interactive Group .
How Are Returns Trending?
We aren't inspired by the trend, given ROCE has reduced by 74% over the last five years and Zhewen Interactive Group is applying -25% less capital in the business, even after the capital raising they conducted (prior to their latest reported figures).
The Key Takeaway
In summary, it's unfortunate that Zhewen Interactive Group is shrinking its capital base and also generating lower returns. It should come as no surprise then that the stock has fallen 13% over the last five years, so it looks like investors are recognizing these changes. With underlying trends that aren't great in these areas, we'd consider looking elsewhere.
If you want to continue researching Zhewen Interactive Group, you might be interested to know about the 2 warning signs that our analysis has discovered.
If you want to search for solid companies with great earnings, check out this free list of companies with good balance sheets and impressive returns on equity.
Valuation is complex, but we're here to simplify it.
Discover if Zhewen Interactive Group might be undervalued or overvalued with our detailed analysis, featuring fair value estimates, potential risks, dividends, insider trades, and its financial condition.
Access Free AnalysisHave feedback on this article? Concerned about the content? Get in touch with us directly. Alternatively, email editorial-team (at) simplywallst.com.
This article by Simply Wall St is general in nature. We provide commentary based on historical data and analyst forecasts only using an unbiased methodology and our articles are not intended to be financial advice. It does not constitute a recommendation to buy or sell any stock, and does not take account of your objectives, or your financial situation. We aim to bring you long-term focused analysis driven by fundamental data. Note that our analysis may not factor in the latest price-sensitive company announcements or qualitative material. Simply Wall St has no position in any stocks mentioned.
About SHSE:600986
Zhewen Interactive Group
Provides intelligent marketing solutions in China, Hong Kong, Macau, Taiwan, and internationally.
Mediocre balance sheet with low risk.
Market Insights

Advertisement
Community Narratives
The company that turned a verb into a global necessity and basically runs the modern internet, digital ads, smartphones, maps, and AI.
Fair Value US$300.00|5.1% undervalued
OS
Community Contributor
Flowers Foods Pays A Fair Price For Health
Fair Value US$16.12|27.7% undervalued
NV
Community Contributor
TMX Group will thrive with 33.3% profit margin and enduring market moat
Fair Value CA$49.90|0.2% overvalued
LI
Community Contributor
The "Molecular Pencil": Why Beam's Technology is Built to Win
Fair Value US$65.01|64.4% undervalued
DA
Community Contributor