
Advertisement
Global markets have recently shown resilience, with U.S. stocks climbing on easing trade concerns and better-than-expected earnings reports, despite mixed signals from economic data. In such a fluctuating environment, discerning investors often seek out opportunities that may not be immediately obvious but hold substantial potential for growth. Penny stocks, though an outdated term, still represent a segment of the market where smaller or newer companies can offer significant value when they possess strong financials and a clear path to growth.
Top 10 Penny Stocks Globally
| Name | Share Price | Market Cap | Rewards & Risks |
| CNMC Goldmine Holdings (Catalist:5TP) | SGD0.435 | SGD176.3M | ✅ 4 ⚠️ 3 View Analysis > |
| Yangzijiang Shipbuilding (Holdings) (SGX:BS6) | SGD2.18 | SGD8.58B | ✅ 5 ⚠️ 0 View Analysis > |
| Angler Gaming (NGM:ANGL) | SEK3.75 | SEK281.19M | ✅ 4 ⚠️ 3 View Analysis > |
| SKP Resources Bhd (KLSE:SKPRES) | MYR0.905 | MYR1.41B | ✅ 5 ⚠️ 1 View Analysis > |
| NEXG Berhad (KLSE:NEXG) | MYR0.335 | MYR972.23M | ✅ 4 ⚠️ 3 View Analysis > |
| DXN Holdings Bhd (KLSE:DXN) | MYR0.505 | MYR2.51B | ✅ 5 ⚠️ 0 View Analysis > |
| Sarawak Plantation Berhad (KLSE:SWKPLNT) | MYR2.39 | MYR666.89M | ✅ 4 ⚠️ 2 View Analysis > |
| Bosideng International Holdings (SEHK:3998) | HK$4.05 | HK$46.02B | ✅ 4 ⚠️ 1 View Analysis > |
| Lever Style (SEHK:1346) | HK$1.10 | HK$675.12M | ✅ 4 ⚠️ 2 View Analysis > |
| Foresight Group Holdings (LSE:FSG) | £3.89 | £439.59M | ✅ 4 ⚠️ 1 View Analysis > |
Click here to see the full list of 5,655 stocks from our Global Penny Stocks screener.
Here we highlight a subset of our preferred stocks from the screener.
Beijing Haixin Energy TechnologyLtd (SZSE:300072)
Simply Wall St Financial Health Rating: ★★★★★☆
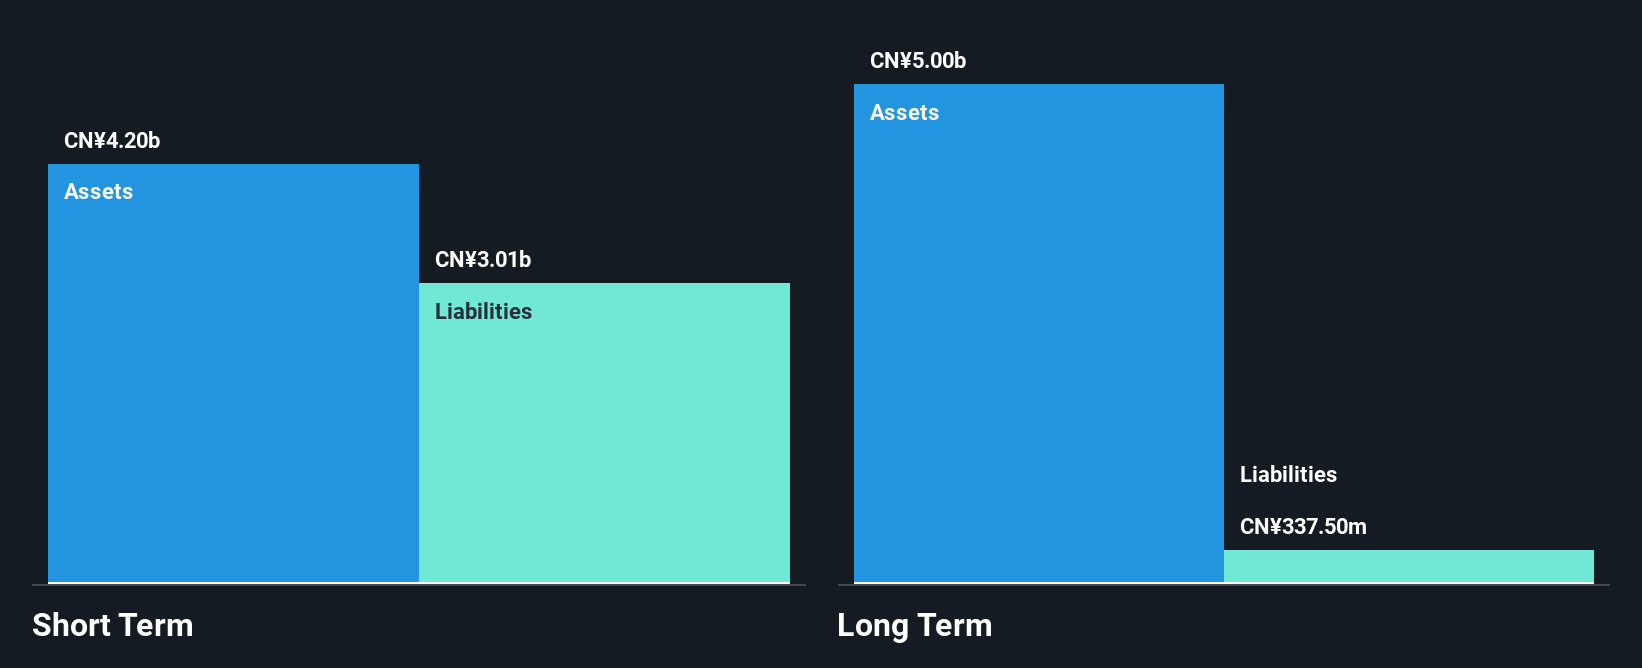
Overview: Beijing Haixin Energy Technology Co., Ltd. operates in the energy technology sector with a market capitalization of CN¥7.10 billion.
Operations: Beijing Haixin Energy Technology Co., Ltd. has not reported any specific revenue segments.
Market Cap: CN¥7.1B
Beijing Haixin Energy Technology Co., Ltd. has demonstrated financial resilience despite challenges, with its short-term assets of CN¥4.2 billion comfortably exceeding both short and long-term liabilities. The company's debt management appears prudent, evidenced by a net debt to equity ratio of 0.7% and operating cash flow covering 38.3% of its debt, indicating solid liquidity management despite being unprofitable currently. Recent earnings reports highlight a significant reduction in sales from CN¥7.65 billion to CN¥2.43 billion year-over-year, alongside increased net losses; however, revenue is forecasted to grow significantly at 35.68% annually moving forward.
- Click to explore a detailed breakdown of our findings in Beijing Haixin Energy TechnologyLtd's financial health report.
- Gain insights into Beijing Haixin Energy TechnologyLtd's future direction by reviewing our growth report.
Shanghai YongLi Belting (SZSE:300230)
Simply Wall St Financial Health Rating: ★★★★★☆
Overview: Shanghai YongLi Belting Co., Ltd is engaged in the development, production, and sale of conveyor belts, with a market cap of CN¥37.00 billion.
Operations: Shanghai YongLi Belting Co., Ltd has not reported any specific revenue segments.
Market Cap: CN¥3.7B
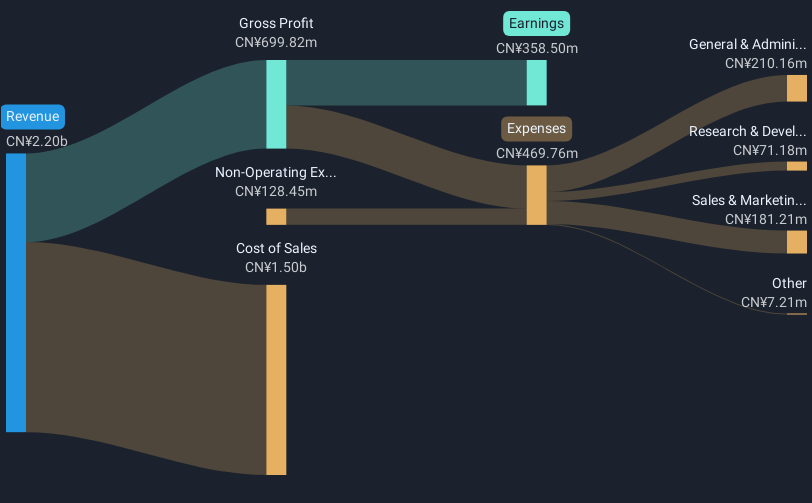
Shanghai YongLi Belting Co., Ltd. shows a mixed financial picture, with a market cap of CN¥37 billion and recent sales growth to CN¥508.05 million for Q1 2025 from CN¥425.02 million the previous year, yet net income slightly decreased to CN¥33.63 million. Despite this, the company maintains high-quality earnings and has more cash than total debt, indicating sound liquidity management. However, its profit margins have declined from 18.6% to 9.5%, and earnings growth was negative over the past year at -43.2%. The stock remains highly volatile but has not experienced significant shareholder dilution recently.
- Click here and access our complete financial health analysis report to understand the dynamics of Shanghai YongLi Belting.
- Review our historical performance report to gain insights into Shanghai YongLi Belting's track record.
Sichuan Etrol Technologies (SZSE:300370)
Simply Wall St Financial Health Rating: ★★★★★☆
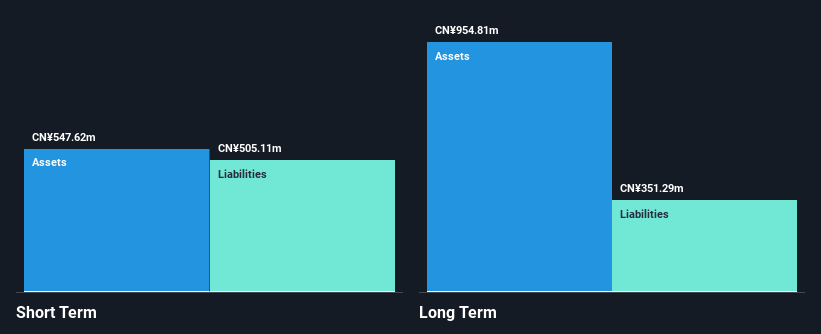
Overview: Sichuan Etrol Technologies Co., Ltd. specializes in the manufacture and sale of smart industry, automation, and oil and gas products and solutions in China, with a market cap of CN¥4.43 billion.
Operations: Sichuan Etrol Technologies Co., Ltd. does not report specific revenue segments.
Market Cap: CN¥4.43B
Sichuan Etrol Technologies Co., Ltd. presents a complex financial scenario, with a market cap of CN¥4.43 billion and Q1 2025 sales of CN¥40.91 million, down from the previous year. The company remains unprofitable, reporting a net loss increase to CN¥25.49 million for the quarter. Despite this, its short-term assets exceed both short and long-term liabilities, providing some financial stability. The board and management are experienced with average tenures of 3 years and 7.3 years respectively, while debt levels have improved over five years but remain high at a net debt to equity ratio of 61.4%.
- Take a closer look at Sichuan Etrol Technologies' potential here in our financial health report.
- Evaluate Sichuan Etrol Technologies' historical performance by accessing our past performance report.
Key Takeaways
- Unlock more gems! Our Global Penny Stocks screener has unearthed 5,652 more companies for you to explore.Click here to unveil our expertly curated list of 5,655 Global Penny Stocks.
- Seeking Other Investments? AI is about to change healthcare. These 26 stocks are working on everything from early diagnostics to drug discovery. The best part - they are all under $10b in market cap - there's still time to get in early.
This article by Simply Wall St is general in nature. We provide commentary based on historical data and analyst forecasts only using an unbiased methodology and our articles are not intended to be financial advice. It does not constitute a recommendation to buy or sell any stock, and does not take account of your objectives, or your financial situation. We aim to bring you long-term focused analysis driven by fundamental data. Note that our analysis may not factor in the latest price-sensitive company announcements or qualitative material. Simply Wall St has no position in any stocks mentioned.
New: Manage All Your Stock Portfolios in One Place
We've created the ultimate portfolio companion for stock investors, and it's free.
• Connect an unlimited number of Portfolios and see your total in one currency
• Be alerted to new Warning Signs or Risks via email or mobile
• Track the Fair Value of your stocks
Have feedback on this article? Concerned about the content? Get in touch with us directly. Alternatively, email editorial-team@simplywallst.com
About SZSE:300230
Flawless balance sheet average dividend payer.
Market Insights

Advertisement
Community Narratives
The "Molecular Pencil": Why Beam's Technology is Built to Win
Fair Value US$65.01|65.4% undervalued
DA
Community Contributor
The silent giant behind virtually every advanced chip powering AI, smartphones, and modern infrastructure.
Fair Value US$310.00|6.1% undervalued
OS
Community Contributor
ADP Stock: Solid Fundamentals, But AI Investments Test Its Margin Resilience
Fair Value US$387.77|34.2% undervalued
YI
Community Contributor
MINISO's fair value is projected at 26.69 with an anticipated PE ratio shift of 20x
Fair Value US$24.03|9.6% undervalued
BE
Community Contributor