
Advertisement
Guangdong Tloong Technology GroupLtd (SZSE:300063) May Have Issues Allocating Its Capital
What trends should we look for it we want to identify stocks that can multiply in value over the long term? Typically, we'll want to notice a trend of growing return on capital employed (ROCE) and alongside that, an expanding base of capital employed. Ultimately, this demonstrates that it's a business that is reinvesting profits at increasing rates of return. Having said that, from a first glance at Guangdong Tloong Technology GroupLtd (SZSE:300063) we aren't jumping out of our chairs at how returns are trending, but let's have a deeper look.
Understanding Return On Capital Employed (ROCE)
For those that aren't sure what ROCE is, it measures the amount of pre-tax profits a company can generate from the capital employed in its business. Analysts use this formula to calculate it for Guangdong Tloong Technology GroupLtd:
Return on Capital Employed = Earnings Before Interest and Tax (EBIT) ÷ (Total Assets - Current Liabilities)
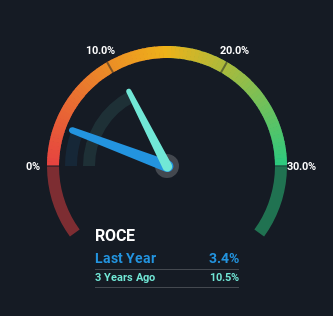
0.034 = CN¥62m ÷ (CN¥3.0b - CN¥1.2b) (Based on the trailing twelve months to March 2024).
Therefore, Guangdong Tloong Technology GroupLtd has an ROCE of 3.4%. In absolute terms, that's a low return and it also under-performs the Chemicals industry average of 5.5%.
View our latest analysis for Guangdong Tloong Technology GroupLtd
While the past is not representative of the future, it can be helpful to know how a company has performed historically, which is why we have this chart above. If you'd like to look at how Guangdong Tloong Technology GroupLtd has performed in the past in other metrics, you can view this free graph of Guangdong Tloong Technology GroupLtd's past earnings, revenue and cash flow.
What Can We Tell From Guangdong Tloong Technology GroupLtd's ROCE Trend?
On the surface, the trend of ROCE at Guangdong Tloong Technology GroupLtd doesn't inspire confidence. Over the last five years, returns on capital have decreased to 3.4% from 12% five years ago. And considering revenue has dropped while employing more capital, we'd be cautious. This could mean that the business is losing its competitive advantage or market share, because while more money is being put into ventures, it's actually producing a lower return - "less bang for their buck" per se.
On a side note, Guangdong Tloong Technology GroupLtd has done well to pay down its current liabilities to 40% of total assets. That could partly explain why the ROCE has dropped. Effectively this means their suppliers or short-term creditors are funding less of the business, which reduces some elements of risk. Since the business is basically funding more of its operations with it's own money, you could argue this has made the business less efficient at generating ROCE. Keep in mind 40% is still pretty high, so those risks are still somewhat prevalent.
The Bottom Line
From the above analysis, we find it rather worrisome that returns on capital and sales for Guangdong Tloong Technology GroupLtd have fallen, meanwhile the business is employing more capital than it was five years ago. In spite of that, the stock has delivered a 14% return to shareholders who held over the last five years. Either way, we aren't huge fans of the current trends and so with that we think you might find better investments elsewhere.
One final note, you should learn about the 3 warning signs we've spotted with Guangdong Tloong Technology GroupLtd (including 1 which is concerning) .
While Guangdong Tloong Technology GroupLtd may not currently earn the highest returns, we've compiled a list of companies that currently earn more than 25% return on equity. Check out this free list here.
New: Manage All Your Stock Portfolios in One Place
We've created the ultimate portfolio companion for stock investors, and it's free.
• Connect an unlimited number of Portfolios and see your total in one currency
• Be alerted to new Warning Signs or Risks via email or mobile
• Track the Fair Value of your stocks
Have feedback on this article? Concerned about the content? Get in touch with us directly. Alternatively, email editorial-team (at) simplywallst.com.
This article by Simply Wall St is general in nature. We provide commentary based on historical data and analyst forecasts only using an unbiased methodology and our articles are not intended to be financial advice. It does not constitute a recommendation to buy or sell any stock, and does not take account of your objectives, or your financial situation. We aim to bring you long-term focused analysis driven by fundamental data. Note that our analysis may not factor in the latest price-sensitive company announcements or qualitative material. Simply Wall St has no position in any stocks mentioned.
About SZSE:300063
Guangdong Tloong Technology GroupLtd
Researches, develops, and sells various printing ink products in China and internationally.
Solid track record with excellent balance sheet.
Market Insights

Advertisement
Community Narratives
The "Molecular Pencil": Why Beam's Technology is Built to Win
Fair Value US$65.01|65.8% undervalued
DA
Community Contributor
The silent giant behind virtually every advanced chip powering AI, smartphones, and modern infrastructure.
Fair Value US$310.00|7.6% undervalued
OS
Community Contributor
ADP Stock: Solid Fundamentals, But AI Investments Test Its Margin Resilience
Fair Value US$387.77|34.5% undervalued
YI
Community Contributor