
Advertisement
Even With A 28% Surge, Cautious Investors Are Not Rewarding Hubei Kailong Chemical Group Co., Ltd.'s (SZSE:002783) Performance Completely
Hubei Kailong Chemical Group Co., Ltd. (SZSE:002783) shareholders are no doubt pleased to see that the share price has bounced 28% in the last month, although it is still struggling to make up recently lost ground. Unfortunately, the gains of the last month did little to right the losses of the last year with the stock still down 12% over that time.
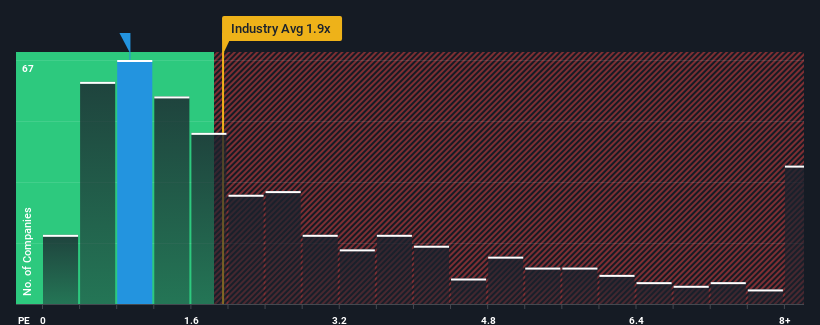
Even after such a large jump in price, Hubei Kailong Chemical Group may still be sending bullish signals at the moment with its price-to-sales (or "P/S") ratio of 0.9x, since almost half of all companies in the Chemicals industry in China have P/S ratios greater than 1.9x and even P/S higher than 4x are not unusual. However, the P/S might be low for a reason and it requires further investigation to determine if it's justified.
See our latest analysis for Hubei Kailong Chemical Group
How Has Hubei Kailong Chemical Group Performed Recently?
Hubei Kailong Chemical Group has been doing a good job lately as it's been growing revenue at a solid pace. One possibility is that the P/S is low because investors think this respectable revenue growth might actually underperform the broader industry in the near future. If you like the company, you'd be hoping this isn't the case so that you could potentially pick up some stock while it's out of favour.
We don't have analyst forecasts, but you can see how recent trends are setting up the company for the future by checking out our free report on Hubei Kailong Chemical Group's earnings, revenue and cash flow.Do Revenue Forecasts Match The Low P/S Ratio?
There's an inherent assumption that a company should underperform the industry for P/S ratios like Hubei Kailong Chemical Group's to be considered reasonable.
Retrospectively, the last year delivered a decent 12% gain to the company's revenues. This was backed up an excellent period prior to see revenue up by 107% in total over the last three years. So we can start by confirming that the company has done a great job of growing revenues over that time.
Weighing that recent medium-term revenue trajectory against the broader industry's one-year forecast for expansion of 25% shows it's about the same on an annualised basis.
In light of this, it's peculiar that Hubei Kailong Chemical Group's P/S sits below the majority of other companies. Apparently some shareholders are more bearish than recent times would indicate and have been accepting lower selling prices.
The Key Takeaway
Despite Hubei Kailong Chemical Group's share price climbing recently, its P/S still lags most other companies. Using the price-to-sales ratio alone to determine if you should sell your stock isn't sensible, however it can be a practical guide to the company's future prospects.
Our examination of Hubei Kailong Chemical Group revealed its three-year revenue trends looking similar to current industry expectations hasn't given the P/S the boost we expected, given that it's lower than the wider industry P/S, There could be some unobserved threats to revenue preventing the P/S ratio from matching the company's performance. At least the risk of a price drop looks to be subdued if recent medium-term revenue trends continue, but investors seem to think future revenue could see some volatility.
Having said that, be aware Hubei Kailong Chemical Group is showing 3 warning signs in our investment analysis, and 2 of those are potentially serious.
It's important to make sure you look for a great company, not just the first idea you come across. So if growing profitability aligns with your idea of a great company, take a peek at this free list of interesting companies with strong recent earnings growth (and a low P/E).
Valuation is complex, but we're here to simplify it.
Discover if Hubei Kailong Chemical Group might be undervalued or overvalued with our detailed analysis, featuring fair value estimates, potential risks, dividends, insider trades, and its financial condition.
Access Free AnalysisHave feedback on this article? Concerned about the content? Get in touch with us directly. Alternatively, email editorial-team (at) simplywallst.com.
This article by Simply Wall St is general in nature. We provide commentary based on historical data and analyst forecasts only using an unbiased methodology and our articles are not intended to be financial advice. It does not constitute a recommendation to buy or sell any stock, and does not take account of your objectives, or your financial situation. We aim to bring you long-term focused analysis driven by fundamental data. Note that our analysis may not factor in the latest price-sensitive company announcements or qualitative material. Simply Wall St has no position in any stocks mentioned.
About SZSE:002783
Hubei Kailong Chemical Group
Engages in the production and sale of explosive materials primarily in China.
Solid track record with excellent balance sheet.
Market Insights

Advertisement
Community Narratives
The "Molecular Pencil": Why Beam's Technology is Built to Win
Fair Value US$65.01|65.8% undervalued
DA
Community Contributor
The silent giant behind virtually every advanced chip powering AI, smartphones, and modern infrastructure.
Fair Value US$310.00|7.6% undervalued
OS
Community Contributor
ADP Stock: Solid Fundamentals, But AI Investments Test Its Margin Resilience
Fair Value US$387.77|34.5% undervalued
YI
Community Contributor