
Advertisement
Kangda New Materials (Group) (SZSE:002669) Will Want To Turn Around Its Return Trends
If you're not sure where to start when looking for the next multi-bagger, there are a few key trends you should keep an eye out for. One common approach is to try and find a company with returns on capital employed (ROCE) that are increasing, in conjunction with a growing amount of capital employed. Ultimately, this demonstrates that it's a business that is reinvesting profits at increasing rates of return. Although, when we looked at Kangda New Materials (Group) (SZSE:002669), it didn't seem to tick all of these boxes.
What Is Return On Capital Employed (ROCE)?
If you haven't worked with ROCE before, it measures the 'return' (pre-tax profit) a company generates from capital employed in its business. To calculate this metric for Kangda New Materials (Group), this is the formula:
Return on Capital Employed = Earnings Before Interest and Tax (EBIT) ÷ (Total Assets - Current Liabilities)
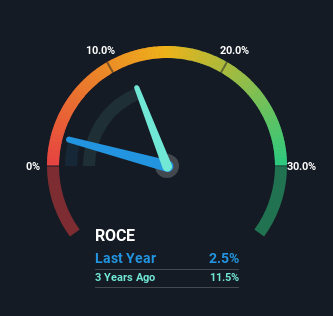
0.025 = CN¥108m ÷ (CN¥6.5b - CN¥2.2b) (Based on the trailing twelve months to September 2023).
Thus, Kangda New Materials (Group) has an ROCE of 2.5%. Ultimately, that's a low return and it under-performs the Chemicals industry average of 6.0%.
Check out our latest analysis for Kangda New Materials (Group)
While the past is not representative of the future, it can be helpful to know how a company has performed historically, which is why we have this chart above. If you're interested in investigating Kangda New Materials (Group)'s past further, check out this free graph covering Kangda New Materials (Group)'s past earnings, revenue and cash flow.
What Can We Tell From Kangda New Materials (Group)'s ROCE Trend?
On the surface, the trend of ROCE at Kangda New Materials (Group) doesn't inspire confidence. Over the last five years, returns on capital have decreased to 2.5% from 3.8% five years ago. However, given capital employed and revenue have both increased it appears that the business is currently pursuing growth, at the consequence of short term returns. And if the increased capital generates additional returns, the business, and thus shareholders, will benefit in the long run.
On a side note, Kangda New Materials (Group)'s current liabilities have increased over the last five years to 34% of total assets, effectively distorting the ROCE to some degree. If current liabilities hadn't increased as much as they did, the ROCE could actually be even lower. While the ratio isn't currently too high, it's worth keeping an eye on this because if it gets particularly high, the business could then face some new elements of risk.
The Bottom Line On Kangda New Materials (Group)'s ROCE
While returns have fallen for Kangda New Materials (Group) in recent times, we're encouraged to see that sales are growing and that the business is reinvesting in its operations. However, total returns to shareholders over the last five years have been flat, which could indicate these growth trends potentially aren't accounted for yet by investors. So we think it'd be worthwhile to look further into this stock given the trends look encouraging.
On a separate note, we've found 2 warning signs for Kangda New Materials (Group) you'll probably want to know about.
While Kangda New Materials (Group) isn't earning the highest return, check out this free list of companies that are earning high returns on equity with solid balance sheets.
Valuation is complex, but we're here to simplify it.
Discover if Kangda New Materials (Group) might be undervalued or overvalued with our detailed analysis, featuring fair value estimates, potential risks, dividends, insider trades, and its financial condition.
Access Free AnalysisHave feedback on this article? Concerned about the content? Get in touch with us directly. Alternatively, email editorial-team (at) simplywallst.com.
This article by Simply Wall St is general in nature. We provide commentary based on historical data and analyst forecasts only using an unbiased methodology and our articles are not intended to be financial advice. It does not constitute a recommendation to buy or sell any stock, and does not take account of your objectives, or your financial situation. We aim to bring you long-term focused analysis driven by fundamental data. Note that our analysis may not factor in the latest price-sensitive company announcements or qualitative material. Simply Wall St has no position in any stocks mentioned.
About SZSE:002669
Kangda New Materials (Group)
Engages in the research and development, production, and sale of structural adhesives in the People's Republic of China.
Mediocre balance sheet and slightly overvalued.
Market Insights

Advertisement
Community Narratives
The company that turned a verb into a global necessity and basically runs the modern internet, digital ads, smartphones, maps, and AI.
Fair Value US$300.00|5.1% undervalued
OS
Community Contributor
Flowers Foods Pays A Fair Price For Health
Fair Value US$16.12|27.7% undervalued
NV
Community Contributor
TMX Group will thrive with 33.3% profit margin and enduring market moat
Fair Value CA$49.90|0.2% overvalued
LI
Community Contributor
The "Molecular Pencil": Why Beam's Technology is Built to Win
Fair Value US$65.01|64.4% undervalued
DA
Community Contributor