
Advertisement
Is Yibin Tianyuan Group (SZSE:002386) Using Debt In A Risky Way?
Warren Buffett famously said, 'Volatility is far from synonymous with risk.' It's only natural to consider a company's balance sheet when you examine how risky it is, since debt is often involved when a business collapses. We can see that Yibin Tianyuan Group Co., Ltd. (SZSE:002386) does use debt in its business. But should shareholders be worried about its use of debt?
When Is Debt A Problem?
Debt is a tool to help businesses grow, but if a business is incapable of paying off its lenders, then it exists at their mercy. If things get really bad, the lenders can take control of the business. However, a more usual (but still expensive) situation is where a company must dilute shareholders at a cheap share price simply to get debt under control. Of course, plenty of companies use debt to fund growth, without any negative consequences. When we think about a company's use of debt, we first look at cash and debt together.
View our latest analysis for Yibin Tianyuan Group
How Much Debt Does Yibin Tianyuan Group Carry?
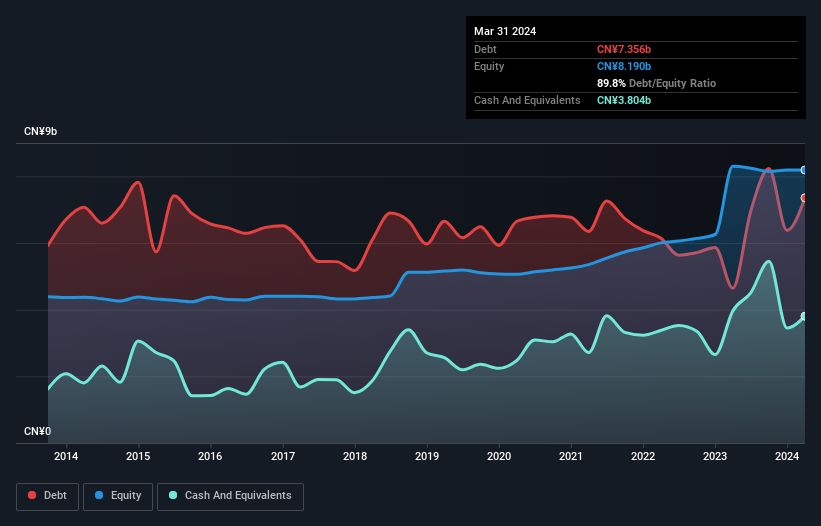
The image below, which you can click on for greater detail, shows that at March 2024 Yibin Tianyuan Group had debt of CN¥7.36b, up from CN¥4.64b in one year. On the flip side, it has CN¥3.80b in cash leading to net debt of about CN¥3.55b.
A Look At Yibin Tianyuan Group's Liabilities
According to the last reported balance sheet, Yibin Tianyuan Group had liabilities of CN¥7.29b due within 12 months, and liabilities of CN¥3.78b due beyond 12 months. Offsetting this, it had CN¥3.80b in cash and CN¥1.31b in receivables that were due within 12 months. So it has liabilities totalling CN¥5.96b more than its cash and near-term receivables, combined.
When you consider that this deficiency exceeds the company's CN¥5.12b market capitalization, you might well be inclined to review the balance sheet intently. Hypothetically, extremely heavy dilution would be required if the company were forced to pay down its liabilities by raising capital at the current share price. When analysing debt levels, the balance sheet is the obvious place to start. But it is Yibin Tianyuan Group's earnings that will influence how the balance sheet holds up in the future. So if you're keen to discover more about its earnings, it might be worth checking out this graph of its long term earnings trend.
Over 12 months, Yibin Tianyuan Group made a loss at the EBIT level, and saw its revenue drop to CN¥18b, which is a fall of 13%. That's not what we would hope to see.
Caveat Emptor
While Yibin Tianyuan Group's falling revenue is about as heartwarming as a wet blanket, arguably its earnings before interest and tax (EBIT) loss is even less appealing. To be specific the EBIT loss came in at CN¥232m. When we look at that alongside the significant liabilities, we're not particularly confident about the company. It would need to improve its operations quickly for us to be interested in it. Not least because it had negative free cash flow of CN¥1.5b over the last twelve months. So suffice it to say we consider the stock to be risky. When analysing debt levels, the balance sheet is the obvious place to start. But ultimately, every company can contain risks that exist outside of the balance sheet. To that end, you should be aware of the 2 warning signs we've spotted with Yibin Tianyuan Group .
If, after all that, you're more interested in a fast growing company with a rock-solid balance sheet, then check out our list of net cash growth stocks without delay.
New: Manage All Your Stock Portfolios in One Place
We've created the ultimate portfolio companion for stock investors, and it's free.
• Connect an unlimited number of Portfolios and see your total in one currency
• Be alerted to new Warning Signs or Risks via email or mobile
• Track the Fair Value of your stocks
Have feedback on this article? Concerned about the content? Get in touch with us directly. Alternatively, email editorial-team (at) simplywallst.com.
This article by Simply Wall St is general in nature. We provide commentary based on historical data and analyst forecasts only using an unbiased methodology and our articles are not intended to be financial advice. It does not constitute a recommendation to buy or sell any stock, and does not take account of your objectives, or your financial situation. We aim to bring you long-term focused analysis driven by fundamental data. Note that our analysis may not factor in the latest price-sensitive company announcements or qualitative material. Simply Wall St has no position in any stocks mentioned.
Have feedback on this article? Concerned about the content? Get in touch with us directly. Alternatively, email editorial-team@simplywallst.com
About SZSE:002386
Yibin Tianyuan Group
Produces and distributes chlor-alkali chemicals in China and internationally.
Slightly overvalued with imperfect balance sheet.
Market Insights

Advertisement
Community Narratives
The company that turned a verb into a global necessity and basically runs the modern internet, digital ads, smartphones, maps, and AI.
Fair Value US$300.00|5.1% undervalued
OS
Community Contributor
Flowers Foods Pays A Fair Price For Health
Fair Value US$16.12|27.7% undervalued
NV
Community Contributor
TMX Group will thrive with 33.3% profit margin and enduring market moat
Fair Value CA$49.90|0.2% overvalued
LI
Community Contributor
The "Molecular Pencil": Why Beam's Technology is Built to Win
Fair Value US$65.01|64.4% undervalued
DA
Community Contributor