
Advertisement
- China
- /
- Basic Materials
- /
- SZSE:000023
Shenzhen Universe Group Co., Ltd.'s (SZSE:000023) 28% Dip Still Leaving Some Shareholders Feeling Restless Over Its P/SRatio
To the annoyance of some shareholders, Shenzhen Universe Group Co., Ltd. (SZSE:000023) shares are down a considerable 28% in the last month, which continues a horrid run for the company. The recent drop completes a disastrous twelve months for shareholders, who are sitting on a 64% loss during that time.
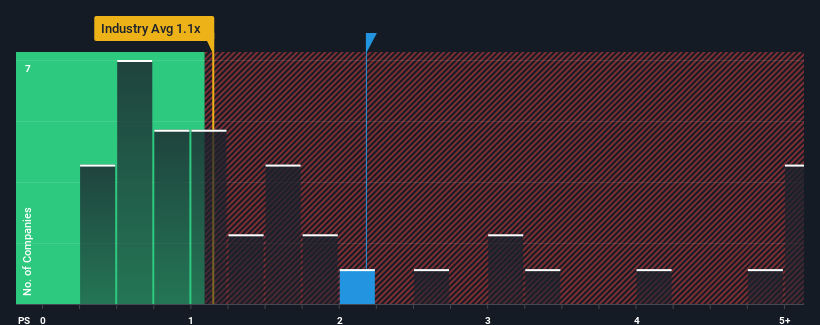
Even after such a large drop in price, given close to half the companies operating in China's Basic Materials industry have price-to-sales ratios (or "P/S") below 1.1x, you may still consider Shenzhen Universe Group as a stock to potentially avoid with its 2.2x P/S ratio. Although, it's not wise to just take the P/S at face value as there may be an explanation why it's as high as it is.
View our latest analysis for Shenzhen Universe Group
How Shenzhen Universe Group Has Been Performing
For instance, Shenzhen Universe Group's receding revenue in recent times would have to be some food for thought. It might be that many expect the company to still outplay most other companies over the coming period, which has kept the P/S from collapsing. You'd really hope so, otherwise you're paying a pretty hefty price for no particular reason.
Although there are no analyst estimates available for Shenzhen Universe Group, take a look at this free data-rich visualisation to see how the company stacks up on earnings, revenue and cash flow.Is There Enough Revenue Growth Forecasted For Shenzhen Universe Group?
The only time you'd be truly comfortable seeing a P/S as high as Shenzhen Universe Group's is when the company's growth is on track to outshine the industry.
Retrospectively, the last year delivered a frustrating 68% decrease to the company's top line. The last three years don't look nice either as the company has shrunk revenue by 87% in aggregate. Therefore, it's fair to say the revenue growth recently has been undesirable for the company.
Comparing that to the industry, which is predicted to deliver 6.7% growth in the next 12 months, the company's downward momentum based on recent medium-term revenue results is a sobering picture.
With this information, we find it concerning that Shenzhen Universe Group is trading at a P/S higher than the industry. It seems most investors are ignoring the recent poor growth rate and are hoping for a turnaround in the company's business prospects. Only the boldest would assume these prices are sustainable as a continuation of recent revenue trends is likely to weigh heavily on the share price eventually.
The Bottom Line On Shenzhen Universe Group's P/S
There's still some elevation in Shenzhen Universe Group's P/S, even if the same can't be said for its share price recently. Typically, we'd caution against reading too much into price-to-sales ratios when settling on investment decisions, though it can reveal plenty about what other market participants think about the company.
Our examination of Shenzhen Universe Group revealed its shrinking revenue over the medium-term isn't resulting in a P/S as low as we expected, given the industry is set to grow. Right now we aren't comfortable with the high P/S as this revenue performance is highly unlikely to support such positive sentiment for long. Unless the the circumstances surrounding the recent medium-term improve, it wouldn't be wrong to expect a a difficult period ahead for the company's shareholders.
You need to take note of risks, for example - Shenzhen Universe Group has 2 warning signs (and 1 which is potentially serious) we think you should know about.
If you're unsure about the strength of Shenzhen Universe Group's business, why not explore our interactive list of stocks with solid business fundamentals for some other companies you may have missed.
New: Manage All Your Stock Portfolios in One Place
We've created the ultimate portfolio companion for stock investors, and it's free.
• Connect an unlimited number of Portfolios and see your total in one currency
• Be alerted to new Warning Signs or Risks via email or mobile
• Track the Fair Value of your stocks
Have feedback on this article? Concerned about the content? Get in touch with us directly. Alternatively, email editorial-team (at) simplywallst.com.
This article by Simply Wall St is general in nature. We provide commentary based on historical data and analyst forecasts only using an unbiased methodology and our articles are not intended to be financial advice. It does not constitute a recommendation to buy or sell any stock, and does not take account of your objectives, or your financial situation. We aim to bring you long-term focused analysis driven by fundamental data. Note that our analysis may not factor in the latest price-sensitive company announcements or qualitative material. Simply Wall St has no position in any stocks mentioned.
About SZSE:000023
Shenzhen Universe Group
Engages in the production and selling of commercial concrete in the People's Republic of China.
Slight with imperfect balance sheet.
Market Insights

Advertisement
Community Narratives
The company that turned a verb into a global necessity and basically runs the modern internet, digital ads, smartphones, maps, and AI.
Fair Value US$300.00|7.1% undervalued
OS
Community Contributor
Flowers Foods Pays A Fair Price For Health
Fair Value US$16.12|26.4% undervalued
NV
Community Contributor
TMX Group will thrive with 33.3% profit margin and enduring market moat
Fair Value CA$49.90|0.8% overvalued
LI
Community Contributor
The "Molecular Pencil": Why Beam's Technology is Built to Win
Fair Value US$65.01|65.8% undervalued
DA
Community Contributor