
Advertisement
Shenzhen Original Advanced Compounds Co., Ltd.'s (SHSE:603991) 27% Share Price Surge Not Quite Adding Up
Shenzhen Original Advanced Compounds Co., Ltd. (SHSE:603991) shares have continued their recent momentum with a 27% gain in the last month alone. Looking back a bit further, it's encouraging to see the stock is up 27% in the last year.
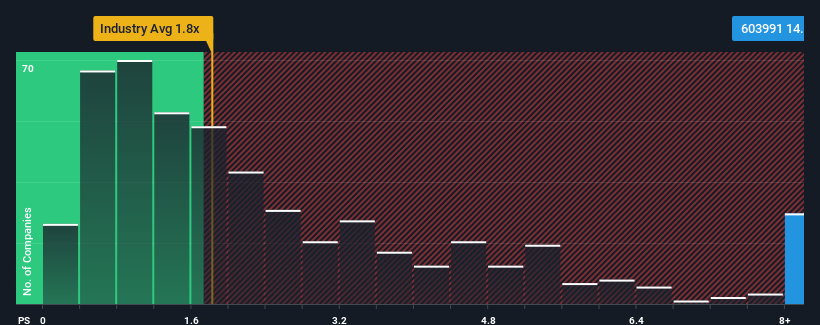
Since its price has surged higher, given around half the companies in China's Chemicals industry have price-to-sales ratios (or "P/S") below 1.8x, you may consider Shenzhen Original Advanced Compounds as a stock to avoid entirely with its 14.4x P/S ratio. Although, it's not wise to just take the P/S at face value as there may be an explanation why it's so lofty.
Check out our latest analysis for Shenzhen Original Advanced Compounds
What Does Shenzhen Original Advanced Compounds' Recent Performance Look Like?
Recent times have been quite advantageous for Shenzhen Original Advanced Compounds as its revenue has been rising very briskly. Perhaps the market is expecting future revenue performance to outperform the wider market, which has seemingly got people interested in the stock. If not, then existing shareholders might be a little nervous about the viability of the share price.
Want the full picture on earnings, revenue and cash flow for the company? Then our free report on Shenzhen Original Advanced Compounds will help you shine a light on its historical performance.Is There Enough Revenue Growth Forecasted For Shenzhen Original Advanced Compounds?
In order to justify its P/S ratio, Shenzhen Original Advanced Compounds would need to produce outstanding growth that's well in excess of the industry.
If we review the last year of revenue growth, the company posted a terrific increase of 35%. The strong recent performance means it was also able to grow revenue by 31% in total over the last three years. So we can start by confirming that the company has done a great job of growing revenue over that time.
This is in contrast to the rest of the industry, which is expected to grow by 21% over the next year, materially higher than the company's recent medium-term annualised growth rates.
With this in mind, we find it worrying that Shenzhen Original Advanced Compounds' P/S exceeds that of its industry peers. Apparently many investors in the company are way more bullish than recent times would indicate and aren't willing to let go of their stock at any price. Only the boldest would assume these prices are sustainable as a continuation of recent revenue trends is likely to weigh heavily on the share price eventually.
The Final Word
The strong share price surge has lead to Shenzhen Original Advanced Compounds' P/S soaring as well. While the price-to-sales ratio shouldn't be the defining factor in whether you buy a stock or not, it's quite a capable barometer of revenue expectations.
Our examination of Shenzhen Original Advanced Compounds revealed its poor three-year revenue trends aren't detracting from the P/S as much as we though, given they look worse than current industry expectations. When we see slower than industry revenue growth but an elevated P/S, there's considerable risk of the share price declining, sending the P/S lower. If recent medium-term revenue trends continue, it will place shareholders' investments at significant risk and potential investors in danger of paying an excessive premium.
Having said that, be aware Shenzhen Original Advanced Compounds is showing 2 warning signs in our investment analysis, and 1 of those can't be ignored.
If strong companies turning a profit tickle your fancy, then you'll want to check out this free list of interesting companies that trade on a low P/E (but have proven they can grow earnings).
New: Manage All Your Stock Portfolios in One Place
We've created the ultimate portfolio companion for stock investors, and it's free.
• Connect an unlimited number of Portfolios and see your total in one currency
• Be alerted to new Warning Signs or Risks via email or mobile
• Track the Fair Value of your stocks
Have feedback on this article? Concerned about the content? Get in touch with us directly. Alternatively, email editorial-team (at) simplywallst.com.
This article by Simply Wall St is general in nature. We provide commentary based on historical data and analyst forecasts only using an unbiased methodology and our articles are not intended to be financial advice. It does not constitute a recommendation to buy or sell any stock, and does not take account of your objectives, or your financial situation. We aim to bring you long-term focused analysis driven by fundamental data. Note that our analysis may not factor in the latest price-sensitive company announcements or qualitative material. Simply Wall St has no position in any stocks mentioned.
About SHSE:603991
Shenzhen Original Advanced Compounds
Shenzhen Original Advanced Compounds Co., Ltd.
Adequate balance sheet with weak fundamentals.
Market Insights

Advertisement
Community Narratives
The "Molecular Pencil": Why Beam's Technology is Built to Win
Fair Value US$65.01|66.7% undervalued
DA
Community Contributor
The silent giant behind virtually every advanced chip powering AI, smartphones, and modern infrastructure.
Fair Value US$310.00|4.8% undervalued
OS
Community Contributor
ADP Stock: Solid Fundamentals, But AI Investments Test Its Margin Resilience
Fair Value US$387.77|34.5% undervalued
YI
Community Contributor
MINISO's fair value is projected at 26.69 with an anticipated PE ratio shift of 20x
Fair Value US$26.69|18.6% undervalued
BE
Community Contributor