- China
- /
- Metals and Mining
- /
- SHSE:600569
Anyang Iron and SteelLtd (SHSE:600569 shareholders incur further losses as stock declines 8.8% this week, taking three-year losses to 49%


As an investor its worth striving to ensure your overall portfolio beats the market average. But in any portfolio, there are likely to be some stocks that fall short of that benchmark. Unfortunately, that's been the case for longer term Anyang Iron and Steel Co.,Ltd. (SHSE:600569) shareholders, since the share price is down 52% in the last three years, falling well short of the market decline of around 22%. And the ride hasn't got any smoother in recent times over the last year, with the price 24% lower in that time. Furthermore, it's down 11% in about a quarter. That's not much fun for holders.
After losing 8.8% this past week, it's worth investigating the company's fundamentals to see what we can infer from past performance.
View our latest analysis for Anyang Iron and SteelLtd
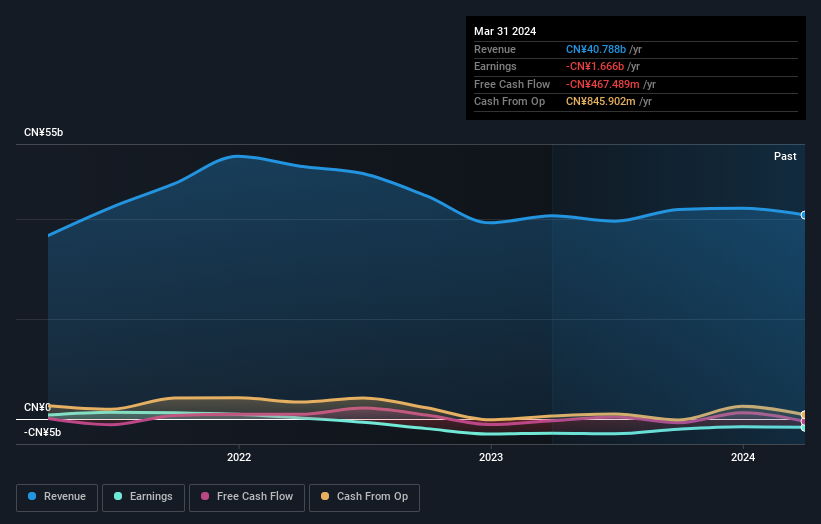
Anyang Iron and SteelLtd isn't currently profitable, so most analysts would look to revenue growth to get an idea of how fast the underlying business is growing. When a company doesn't make profits, we'd generally hope to see good revenue growth. That's because fast revenue growth can be easily extrapolated to forecast profits, often of considerable size.
In the last three years Anyang Iron and SteelLtd saw its revenue shrink by 3.3% per year. That is not a good result. With revenue in decline, and profit but a dream, we can understand why the share price has been declining at 15% per year. Having said that, if growth is coming in the future, now may be the low ebb for the company. We'd be pretty wary of this one until it makes a profit, because we don't specialize in finding turnaround situations.
You can see below how earnings and revenue have changed over time (discover the exact values by clicking on the image).
We're pleased to report that the CEO is remunerated more modestly than most CEOs at similarly capitalized companies. It's always worth keeping an eye on CEO pay, but a more important question is whether the company will grow earnings throughout the years. Dive deeper into the earnings by checking this interactive graph of Anyang Iron and SteelLtd's earnings, revenue and cash flow.
What About The Total Shareholder Return (TSR)?
We'd be remiss not to mention the difference between Anyang Iron and SteelLtd's total shareholder return (TSR) and its share price return. Arguably the TSR is a more complete return calculation because it accounts for the value of dividends (as if they were reinvested), along with the hypothetical value of any discounted capital that have been offered to shareholders. Dividends have been really beneficial for Anyang Iron and SteelLtd shareholders, and that cash payout explains why its total shareholder loss of 49%, over the last 3 years, isn't as bad as the share price return.
A Different Perspective
We regret to report that Anyang Iron and SteelLtd shareholders are down 24% for the year. Unfortunately, that's worse than the broader market decline of 10%. However, it could simply be that the share price has been impacted by broader market jitters. It might be worth keeping an eye on the fundamentals, in case there's a good opportunity. Unfortunately, last year's performance may indicate unresolved challenges, given that it was worse than the annualised loss of 7% over the last half decade. Generally speaking long term share price weakness can be a bad sign, though contrarian investors might want to research the stock in hope of a turnaround. While it is well worth considering the different impacts that market conditions can have on the share price, there are other factors that are even more important. Take risks, for example - Anyang Iron and SteelLtd has 1 warning sign we think you should be aware of.
Of course, you might find a fantastic investment by looking elsewhere. So take a peek at this free list of companies we expect will grow earnings.
Please note, the market returns quoted in this article reflect the market weighted average returns of stocks that currently trade on Chinese exchanges.
New: Manage All Your Stock Portfolios in One Place
We've created the ultimate portfolio companion for stock investors, and it's free.
• Connect an unlimited number of Portfolios and see your total in one currency
• Be alerted to new Warning Signs or Risks via email or mobile
• Track the Fair Value of your stocks
Have feedback on this article? Concerned about the content? Get in touch with us directly. Alternatively, email editorial-team (at) simplywallst.com.
This article by Simply Wall St is general in nature. We provide commentary based on historical data and analyst forecasts only using an unbiased methodology and our articles are not intended to be financial advice. It does not constitute a recommendation to buy or sell any stock, and does not take account of your objectives, or your financial situation. We aim to bring you long-term focused analysis driven by fundamental data. Note that our analysis may not factor in the latest price-sensitive company announcements or qualitative material. Simply Wall St has no position in any stocks mentioned.
About SHSE:600569
Anyang Iron and SteelLtd
Engages in manufacture and sale of steel products by using processing technology in China and internationally.
Adequate balance sheet and slightly overvalued.
