Stock Analysis
- China
- /
- Paper and Forestry Products
- /
- SHSE:600567
Shanying International HoldingsLtd (SHSE:600567) stock falls 6.8% in past week as five-year earnings and shareholder returns continue downward trend


Generally speaking long term investing is the way to go. But no-one is immune from buying too high. Zooming in on an example, the Shanying International Holdings Co.,Ltd (SHSE:600567) share price dropped 58% in the last half decade. That is extremely sub-optimal, to say the least. And it's not just long term holders hurting, because the stock is down 41% in the last year. The falls have accelerated recently, with the share price down 23% in the last three months.
If the past week is anything to go by, investor sentiment for Shanying International HoldingsLtd isn't positive, so let's see if there's a mismatch between fundamentals and the share price.
Check out our latest analysis for Shanying International HoldingsLtd
There is no denying that markets are sometimes efficient, but prices do not always reflect underlying business performance. One flawed but reasonable way to assess how sentiment around a company has changed is to compare the earnings per share (EPS) with the share price.
Shanying International HoldingsLtd became profitable within the last five years. That would generally be considered a positive, so we are surprised to see the share price is down. Other metrics might give us a better handle on how its value is changing over time.
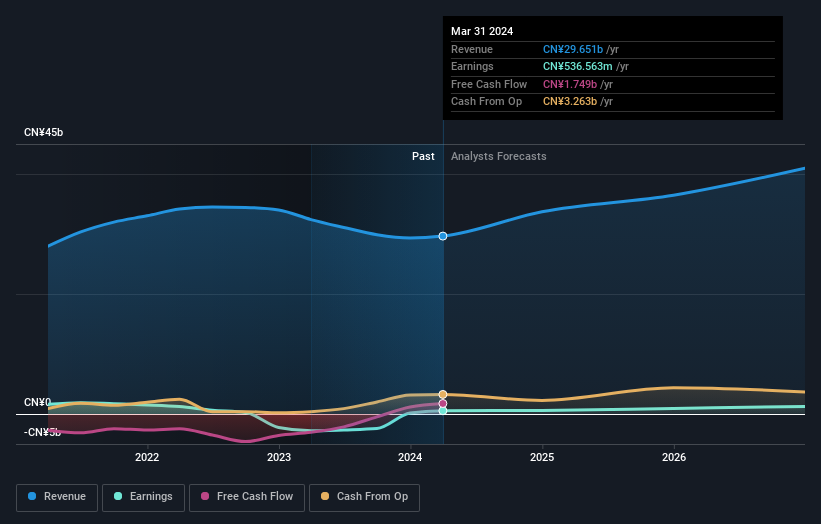
In contrast to the share price, revenue has actually increased by 7.7% a year in the five year period. A more detailed examination of the revenue and earnings may or may not explain why the share price languishes; there could be an opportunity.
You can see below how earnings and revenue have changed over time (discover the exact values by clicking on the image).
We know that Shanying International HoldingsLtd has improved its bottom line lately, but what does the future have in store? So it makes a lot of sense to check out what analysts think Shanying International HoldingsLtd will earn in the future (free profit forecasts).
What About The Total Shareholder Return (TSR)?
We'd be remiss not to mention the difference between Shanying International HoldingsLtd's total shareholder return (TSR) and its share price return. Arguably the TSR is a more complete return calculation because it accounts for the value of dividends (as if they were reinvested), along with the hypothetical value of any discounted capital that have been offered to shareholders. Dividends have been really beneficial for Shanying International HoldingsLtd shareholders, and that cash payout explains why its total shareholder loss of 56%, over the last 5 years, isn't as bad as the share price return.
A Different Perspective
While the broader market lost about 19% in the twelve months, Shanying International HoldingsLtd shareholders did even worse, losing 41%. However, it could simply be that the share price has been impacted by broader market jitters. It might be worth keeping an eye on the fundamentals, in case there's a good opportunity. Regrettably, last year's performance caps off a bad run, with the shareholders facing a total loss of 9% per year over five years. Generally speaking long term share price weakness can be a bad sign, though contrarian investors might want to research the stock in hope of a turnaround. I find it very interesting to look at share price over the long term as a proxy for business performance. But to truly gain insight, we need to consider other information, too. To that end, you should learn about the 3 warning signs we've spotted with Shanying International HoldingsLtd (including 1 which doesn't sit too well with us) .
Of course Shanying International HoldingsLtd may not be the best stock to buy. So you may wish to see this free collection of growth stocks.
Please note, the market returns quoted in this article reflect the market weighted average returns of stocks that currently trade on Chinese exchanges.
New: Manage All Your Stock Portfolios in One Place
We've created the ultimate portfolio companion for stock investors, and it's free.
• Connect an unlimited number of Portfolios and see your total in one currency
• Be alerted to new Warning Signs or Risks via email or mobile
• Track the Fair Value of your stocks
Have feedback on this article? Concerned about the content? Get in touch with us directly. Alternatively, email editorial-team (at) simplywallst.com.
This article by Simply Wall St is general in nature. We provide commentary based on historical data and analyst forecasts only using an unbiased methodology and our articles are not intended to be financial advice. It does not constitute a recommendation to buy or sell any stock, and does not take account of your objectives, or your financial situation. We aim to bring you long-term focused analysis driven by fundamental data. Note that our analysis may not factor in the latest price-sensitive company announcements or qualitative material. Simply Wall St has no position in any stocks mentioned.
New: Manage All Your Stock Portfolios in One Place
We've created the ultimate portfolio companion for stock investors, and it's free.
• Connect an unlimited number of Portfolios and see your total in one currency
• Be alerted to new Warning Signs or Risks via email or mobile
• Track the Fair Value of your stocks
Have feedback on this article? Concerned about the content? Get in touch with us directly. Alternatively, email editorial-team@simplywallst.com
About SHSE:600567
Shanying International HoldingsLtd
Engages in regenerated fiber, papermaking, packaging, and printing businesses.
Fair value with moderate growth potential.
