- China
- /
- Metals and Mining
- /
- SHSE:600022
Further weakness as Shandong Iron and Steel (SHSE:600022) drops 8.1% this week, taking three-year losses to 31%


As an investor its worth striving to ensure your overall portfolio beats the market average. But in any portfolio, there are likely to be some stocks that fall short of that benchmark. Unfortunately, that's been the case for longer term Shandong Iron and Steel Company Ltd. (SHSE:600022) shareholders, since the share price is down 37% in the last three years, falling well short of the market decline of around 22%. The more recent news is of little comfort, with the share price down 22% in a year. Furthermore, it's down 17% in about a quarter. That's not much fun for holders.
If the past week is anything to go by, investor sentiment for Shandong Iron and Steel isn't positive, so let's see if there's a mismatch between fundamentals and the share price.
See our latest analysis for Shandong Iron and Steel
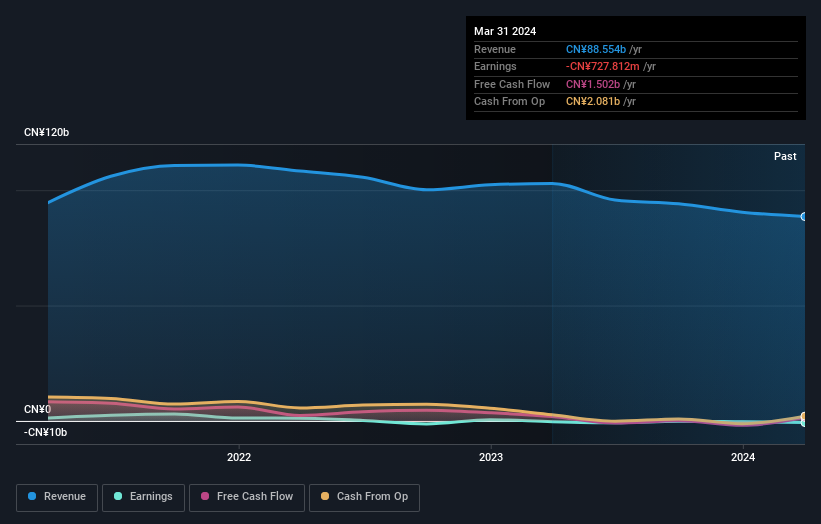
Shandong Iron and Steel wasn't profitable in the last twelve months, it is unlikely we'll see a strong correlation between its share price and its earnings per share (EPS). Arguably revenue is our next best option. When a company doesn't make profits, we'd generally hope to see good revenue growth. Some companies are willing to postpone profitability to grow revenue faster, but in that case one would hope for good top-line growth to make up for the lack of earnings.
In the last three years Shandong Iron and Steel saw its revenue shrink by 5.2% per year. That is not a good result. The annual decline of 11% per year in that period has clearly disappointed holders. And with no profits, and weak revenue, are you surprised? Of course, sentiment could become too negative, and the company may actually be making progress to profitability.
The image below shows how earnings and revenue have tracked over time (if you click on the image you can see greater detail).
Take a more thorough look at Shandong Iron and Steel's financial health with this free report on its balance sheet.
What About Dividends?
It is important to consider the total shareholder return, as well as the share price return, for any given stock. The TSR is a return calculation that accounts for the value of cash dividends (assuming that any dividend received was reinvested) and the calculated value of any discounted capital raisings and spin-offs. So for companies that pay a generous dividend, the TSR is often a lot higher than the share price return. As it happens, Shandong Iron and Steel's TSR for the last 3 years was -31%, which exceeds the share price return mentioned earlier. This is largely a result of its dividend payments!
A Different Perspective
We regret to report that Shandong Iron and Steel shareholders are down 20% for the year (even including dividends). Unfortunately, that's worse than the broader market decline of 10%. However, it could simply be that the share price has been impacted by broader market jitters. It might be worth keeping an eye on the fundamentals, in case there's a good opportunity. Regrettably, last year's performance caps off a bad run, with the shareholders facing a total loss of 5% per year over five years. Generally speaking long term share price weakness can be a bad sign, though contrarian investors might want to research the stock in hope of a turnaround. While it is well worth considering the different impacts that market conditions can have on the share price, there are other factors that are even more important. To that end, you should learn about the 2 warning signs we've spotted with Shandong Iron and Steel (including 1 which shouldn't be ignored) .
Of course Shandong Iron and Steel may not be the best stock to buy. So you may wish to see this free collection of growth stocks.
Please note, the market returns quoted in this article reflect the market weighted average returns of stocks that currently trade on Chinese exchanges.
New: Manage All Your Stock Portfolios in One Place
We've created the ultimate portfolio companion for stock investors, and it's free.
• Connect an unlimited number of Portfolios and see your total in one currency
• Be alerted to new Warning Signs or Risks via email or mobile
• Track the Fair Value of your stocks
Have feedback on this article? Concerned about the content? Get in touch with us directly. Alternatively, email editorial-team (at) simplywallst.com.
This article by Simply Wall St is general in nature. We provide commentary based on historical data and analyst forecasts only using an unbiased methodology and our articles are not intended to be financial advice. It does not constitute a recommendation to buy or sell any stock, and does not take account of your objectives, or your financial situation. We aim to bring you long-term focused analysis driven by fundamental data. Note that our analysis may not factor in the latest price-sensitive company announcements or qualitative material. Simply Wall St has no position in any stocks mentioned.
About SHSE:600022
Mediocre balance sheet and slightly overvalued.
