- China
- /
- Personal Products
- /
- SHSE:603059
Perfect Group Corp., Ltd's (SHSE:603059) Stock Is Rallying But Financials Look Ambiguous: Will The Momentum Continue?


Perfect Group's (SHSE:603059) stock is up by a considerable 18% over the past week. However, we decided to pay attention to the company's fundamentals which don't appear to give a clear sign about the company's financial health. In this article, we decided to focus on Perfect Group's ROE.
ROE or return on equity is a useful tool to assess how effectively a company can generate returns on the investment it received from its shareholders. Put another way, it reveals the company's success at turning shareholder investments into profits.
See our latest analysis for Perfect Group
How Is ROE Calculated?
Return on equity can be calculated by using the formula:
Return on Equity = Net Profit (from continuing operations) ÷ Shareholders' Equity
So, based on the above formula, the ROE for Perfect Group is:
7.5% = CN¥88m ÷ CN¥1.2b (Based on the trailing twelve months to June 2024).
The 'return' refers to a company's earnings over the last year. That means that for every CN¥1 worth of shareholders' equity, the company generated CN¥0.07 in profit.
Why Is ROE Important For Earnings Growth?
So far, we've learned that ROE is a measure of a company's profitability. We now need to evaluate how much profit the company reinvests or "retains" for future growth which then gives us an idea about the growth potential of the company. Assuming all else is equal, companies that have both a higher return on equity and higher profit retention are usually the ones that have a higher growth rate when compared to companies that don't have the same features.
Perfect Group's Earnings Growth And 7.5% ROE
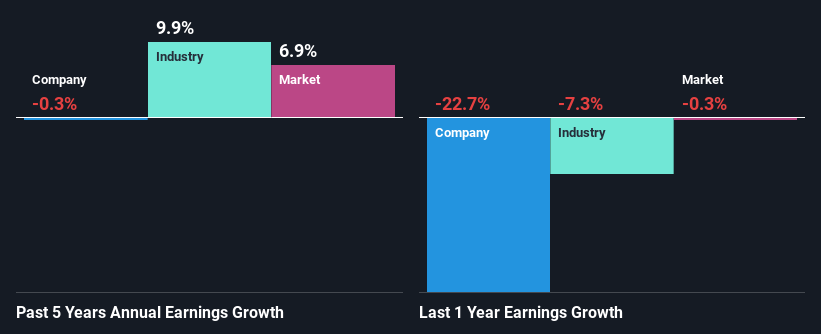
When you first look at it, Perfect Group's ROE doesn't look that attractive. A quick further study shows that the company's ROE doesn't compare favorably to the industry average of 9.8% either. Hence, the flat earnings seen by Perfect Group over the past five years could probably be the result of it having a lower ROE.
We then compared Perfect Group's net income growth with the industry and found that the average industry growth rate was 9.9% in the same 5-year period.
The basis for attaching value to a company is, to a great extent, tied to its earnings growth. What investors need to determine next is if the expected earnings growth, or the lack of it, is already built into the share price. This then helps them determine if the stock is placed for a bright or bleak future. One good indicator of expected earnings growth is the P/E ratio which determines the price the market is willing to pay for a stock based on its earnings prospects. So, you may want to check if Perfect Group is trading on a high P/E or a low P/E, relative to its industry.
Is Perfect Group Using Its Retained Earnings Effectively?
Perfect Group's low three-year median payout ratio of 21% (implying that the company keeps79% of its income) should mean that the company is retaining most of its earnings to fuel its growth and this should be reflected in its growth number, but that's not the case.
Moreover, Perfect Group has been paying dividends for five years, which is a considerable amount of time, suggesting that management must have perceived that the shareholders prefer dividends over earnings growth.
Conclusion
In total, we're a bit ambivalent about Perfect Group's performance. Even though it appears to be retaining most of its profits, given the low ROE, investors may not be benefitting from all that reinvestment after all. The low earnings growth suggests our theory correct. With that said, we studied the latest analyst forecasts and found that while the company has shrunk its earnings in the past, analysts expect its earnings to grow in the future. To know more about the latest analysts predictions for the company, check out this visualization of analyst forecasts for the company.
New: Manage All Your Stock Portfolios in One Place
We've created the ultimate portfolio companion for stock investors, and it's free.
• Connect an unlimited number of Portfolios and see your total in one currency
• Be alerted to new Warning Signs or Risks via email or mobile
• Track the Fair Value of your stocks
Have feedback on this article? Concerned about the content? Get in touch with us directly. Alternatively, email editorial-team (at) simplywallst.com.
This article by Simply Wall St is general in nature. We provide commentary based on historical data and analyst forecasts only using an unbiased methodology and our articles are not intended to be financial advice. It does not constitute a recommendation to buy or sell any stock, and does not take account of your objectives, or your financial situation. We aim to bring you long-term focused analysis driven by fundamental data. Note that our analysis may not factor in the latest price-sensitive company announcements or qualitative material. Simply Wall St has no position in any stocks mentioned.
About SHSE:603059
Perfect Group
Provides manual and electric toothbrushes in the People’s Republic of China.
High growth potential with adequate balance sheet.

