- China
- /
- Healthtech
- /
- SZSE:301337
Yarward Electronics (Shandong) Co., Ltd.'s (SZSE:301337) Stock On An Uptrend: Could Fundamentals Be Driving The Momentum?


Yarward Electronics (Shandong)'s (SZSE:301337) stock is up by a considerable 43% over the past month. We wonder if and what role the company's financials play in that price change as a company's long-term fundamentals usually dictate market outcomes. Particularly, we will be paying attention to Yarward Electronics (Shandong)'s ROE today.
ROE or return on equity is a useful tool to assess how effectively a company can generate returns on the investment it received from its shareholders. Simply put, it is used to assess the profitability of a company in relation to its equity capital.
Check out our latest analysis for Yarward Electronics (Shandong)
How Do You Calculate Return On Equity?
The formula for ROE is:
Return on Equity = Net Profit (from continuing operations) ÷ Shareholders' Equity
So, based on the above formula, the ROE for Yarward Electronics (Shandong) is:
1.6% = CN¥17m ÷ CN¥1.1b (Based on the trailing twelve months to June 2024).
The 'return' is the income the business earned over the last year. That means that for every CN¥1 worth of shareholders' equity, the company generated CN¥0.02 in profit.
Why Is ROE Important For Earnings Growth?
We have already established that ROE serves as an efficient profit-generating gauge for a company's future earnings. Depending on how much of these profits the company reinvests or "retains", and how effectively it does so, we are then able to assess a company’s earnings growth potential. Assuming all else is equal, companies that have both a higher return on equity and higher profit retention are usually the ones that have a higher growth rate when compared to companies that don't have the same features.
Yarward Electronics (Shandong)'s Earnings Growth And 1.6% ROE
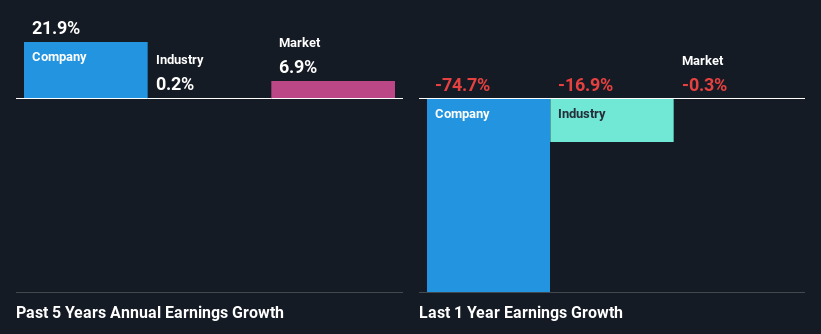
It is hard to argue that Yarward Electronics (Shandong)'s ROE is much good in and of itself. An industry comparison shows that the company's ROE is not much different from the industry average of 1.6% either. However, the exceptional 22% net income growth seen by Yarward Electronics (Shandong) over the past five years is pretty remarkable. Given the low ROE, it is likely that there could be some other reasons behind this growth as well. For instance, the company has a low payout ratio or is being managed efficiently.
Next, on comparing with the industry net income growth, we found that Yarward Electronics (Shandong)'s growth is quite high when compared to the industry average growth of 0.2% in the same period, which is great to see.
The basis for attaching value to a company is, to a great extent, tied to its earnings growth. What investors need to determine next is if the expected earnings growth, or the lack of it, is already built into the share price. This then helps them determine if the stock is placed for a bright or bleak future. If you're wondering about Yarward Electronics (Shandong)'s's valuation, check out this gauge of its price-to-earnings ratio, as compared to its industry.
Is Yarward Electronics (Shandong) Making Efficient Use Of Its Profits?
While the company did pay out a portion of its dividend in the past, it currently doesn't pay a regular dividend. This is likely what's driving the high earnings growth number discussed above.
Summary
Overall, we feel that Yarward Electronics (Shandong) certainly does have some positive factors to consider. Even in spite of the low rate of return, the company has posted impressive earnings growth as a result of reinvesting heavily into its business. So far, we've only made a quick discussion around the company's earnings growth. You can do your own research on Yarward Electronics (Shandong) and see how it has performed in the past by looking at this FREE detailed graph of past earnings, revenue and cash flows.
New: Manage All Your Stock Portfolios in One Place
We've created the ultimate portfolio companion for stock investors, and it's free.
• Connect an unlimited number of Portfolios and see your total in one currency
• Be alerted to new Warning Signs or Risks via email or mobile
• Track the Fair Value of your stocks
Have feedback on this article? Concerned about the content? Get in touch with us directly. Alternatively, email editorial-team (at) simplywallst.com.
This article by Simply Wall St is general in nature. We provide commentary based on historical data and analyst forecasts only using an unbiased methodology and our articles are not intended to be financial advice. It does not constitute a recommendation to buy or sell any stock, and does not take account of your objectives, or your financial situation. We aim to bring you long-term focused analysis driven by fundamental data. Note that our analysis may not factor in the latest price-sensitive company announcements or qualitative material. Simply Wall St has no position in any stocks mentioned.
About SZSE:301337
Yarward Electronics (Shandong)
Engages in the research and development, production, and sale of hospital intelligent communication interactive systems in China.
Adequate balance sheet low.

