Are Poor Financial Prospects Dragging Down General Elevator Co., Ltd (SZSE:300931 Stock?


With its stock down 16% over the past month, it is easy to disregard General Elevator (SZSE:300931). We decided to study the company's financials to determine if the downtrend will continue as the long-term performance of a company usually dictates market outcomes. Particularly, we will be paying attention to General Elevator's ROE today.
ROE or return on equity is a useful tool to assess how effectively a company can generate returns on the investment it received from its shareholders. In simpler terms, it measures the profitability of a company in relation to shareholder's equity.
See our latest analysis for General Elevator
How To Calculate Return On Equity?
The formula for return on equity is:
Return on Equity = Net Profit (from continuing operations) ÷ Shareholders' Equity
So, based on the above formula, the ROE for General Elevator is:
2.0% = CN¥14m ÷ CN¥706m (Based on the trailing twelve months to March 2024).
The 'return' is the yearly profit. Another way to think of that is that for every CN¥1 worth of equity, the company was able to earn CN¥0.02 in profit.
Why Is ROE Important For Earnings Growth?
Thus far, we have learned that ROE measures how efficiently a company is generating its profits. Depending on how much of these profits the company reinvests or "retains", and how effectively it does so, we are then able to assess a company’s earnings growth potential. Assuming all else is equal, companies that have both a higher return on equity and higher profit retention are usually the ones that have a higher growth rate when compared to companies that don't have the same features.
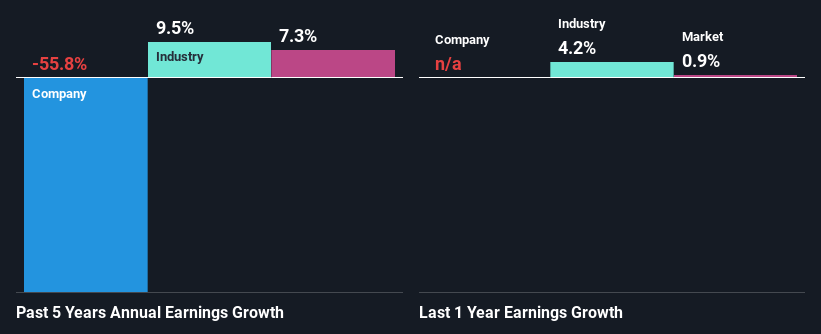
A Side By Side comparison of General Elevator's Earnings Growth And 2.0% ROE
As you can see, General Elevator's ROE looks pretty weak. Not just that, even compared to the industry average of 6.9%, the company's ROE is entirely unremarkable. For this reason, General Elevator's five year net income decline of 56% is not surprising given its lower ROE. However, there could also be other factors causing the earnings to decline. For instance, the company has a very high payout ratio, or is faced with competitive pressures.
That being said, we compared General Elevator's performance with the industry and were concerned when we found that while the company has shrunk its earnings, the industry has grown its earnings at a rate of 9.5% in the same 5-year period.
Earnings growth is an important metric to consider when valuing a stock. It’s important for an investor to know whether the market has priced in the company's expected earnings growth (or decline). This then helps them determine if the stock is placed for a bright or bleak future. Is General Elevator fairly valued compared to other companies? These 3 valuation measures might help you decide.
Is General Elevator Making Efficient Use Of Its Profits?
General Elevator's declining earnings is not surprising given how the company is spending most of its profits in paying dividends, judging by its three-year median payout ratio of 97% (or a retention ratio of 3.0%). With only very little left to reinvest into the business, growth in earnings is far from likely. To know the 4 risks we have identified for General Elevator visit our risks dashboard for free.
Additionally, General Elevator started paying a dividend only recently. So it looks like the management may have perceived that shareholders favor dividends even though earnings have been in decline.
Conclusion
Overall, we would be extremely cautious before making any decision on General Elevator. The low ROE, combined with the fact that the company is paying out almost if not all, of its profits as dividends, has resulted in the lack or absence of growth in its earnings. Up till now, we've only made a short study of the company's growth data. To gain further insights into General Elevator's past profit growth, check out this visualization of past earnings, revenue and cash flows.
New: Manage All Your Stock Portfolios in One Place
We've created the ultimate portfolio companion for stock investors, and it's free.
• Connect an unlimited number of Portfolios and see your total in one currency
• Be alerted to new Warning Signs or Risks via email or mobile
• Track the Fair Value of your stocks
Have feedback on this article? Concerned about the content? Get in touch with us directly. Alternatively, email editorial-team (at) simplywallst.com.
This article by Simply Wall St is general in nature. We provide commentary based on historical data and analyst forecasts only using an unbiased methodology and our articles are not intended to be financial advice. It does not constitute a recommendation to buy or sell any stock, and does not take account of your objectives, or your financial situation. We aim to bring you long-term focused analysis driven by fundamental data. Note that our analysis may not factor in the latest price-sensitive company announcements or qualitative material. Simply Wall St has no position in any stocks mentioned.
About SZSE:300931
General Elevator
GENERAL Elevator Co., Ltd. manufactures and services green elevators worldwide.
Flawless balance sheet slight.
