Shenzhen JT Automation EquipmentLtd (SZSE:300400) earnings and shareholder returns have been trending downwards for the last three years, but the stock pops 11% this past week


Shenzhen JT Automation Equipment Co.,Ltd (SZSE:300400) shareholders should be happy to see the share price up 24% in the last month. But that cannot eclipse the less-than-impressive returns over the last three years. Truth be told the share price declined 45% in three years and that return, Dear Reader, falls short of what you could have got from passive investing with an index fund.
Although the past week has been more reassuring for shareholders, they're still in the red over the last three years, so let's see if the underlying business has been responsible for the decline.
View our latest analysis for Shenzhen JT Automation EquipmentLtd
To paraphrase Benjamin Graham: Over the short term the market is a voting machine, but over the long term it's a weighing machine. One flawed but reasonable way to assess how sentiment around a company has changed is to compare the earnings per share (EPS) with the share price.
During the three years that the share price fell, Shenzhen JT Automation EquipmentLtd's earnings per share (EPS) dropped by 28% each year. In comparison the 18% compound annual share price decline isn't as bad as the EPS drop-off. So the market may not be too worried about the EPS figure, at the moment -- or it may have previously priced some of the drop in. This positive sentiment is also reflected in the generous P/E ratio of 62.70.
The company's earnings per share (over time) is depicted in the image below (click to see the exact numbers).
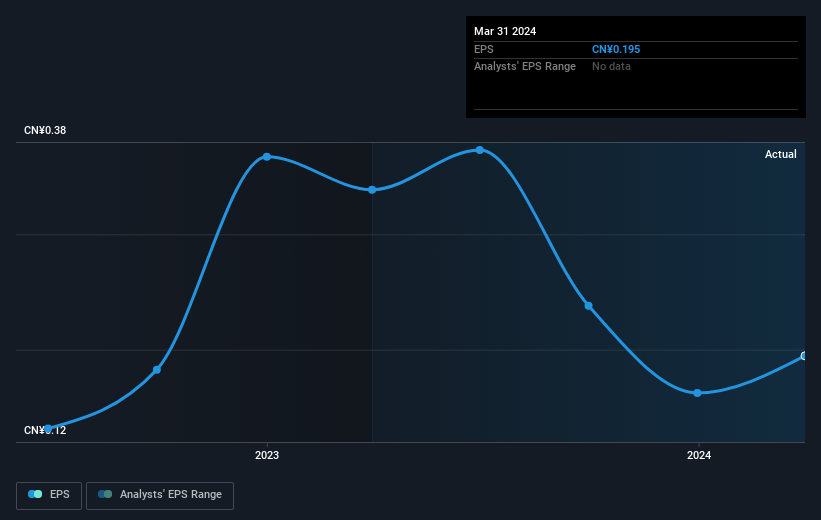
Dive deeper into Shenzhen JT Automation EquipmentLtd's key metrics by checking this interactive graph of Shenzhen JT Automation EquipmentLtd's earnings, revenue and cash flow.
What About Dividends?
It is important to consider the total shareholder return, as well as the share price return, for any given stock. The TSR is a return calculation that accounts for the value of cash dividends (assuming that any dividend received was reinvested) and the calculated value of any discounted capital raisings and spin-offs. It's fair to say that the TSR gives a more complete picture for stocks that pay a dividend. We note that for Shenzhen JT Automation EquipmentLtd the TSR over the last 3 years was -42%, which is better than the share price return mentioned above. And there's no prize for guessing that the dividend payments largely explain the divergence!
A Different Perspective
We regret to report that Shenzhen JT Automation EquipmentLtd shareholders are down 23% for the year (even including dividends). Unfortunately, that's worse than the broader market decline of 8.2%. Having said that, it's inevitable that some stocks will be oversold in a falling market. The key is to keep your eyes on the fundamental developments. Unfortunately, last year's performance may indicate unresolved challenges, given that it was worse than the annualised loss of 4% over the last half decade. Generally speaking long term share price weakness can be a bad sign, though contrarian investors might want to research the stock in hope of a turnaround. I find it very interesting to look at share price over the long term as a proxy for business performance. But to truly gain insight, we need to consider other information, too. Like risks, for instance. Every company has them, and we've spotted 5 warning signs for Shenzhen JT Automation EquipmentLtd (of which 1 makes us a bit uncomfortable!) you should know about.
Of course, you might find a fantastic investment by looking elsewhere. So take a peek at this free list of companies we expect will grow earnings.
Please note, the market returns quoted in this article reflect the market weighted average returns of stocks that currently trade on Chinese exchanges.
New: Manage All Your Stock Portfolios in One Place
We've created the ultimate portfolio companion for stock investors, and it's free.
• Connect an unlimited number of Portfolios and see your total in one currency
• Be alerted to new Warning Signs or Risks via email or mobile
• Track the Fair Value of your stocks
Have feedback on this article? Concerned about the content? Get in touch with us directly. Alternatively, email editorial-team (at) simplywallst.com.
This article by Simply Wall St is general in nature. We provide commentary based on historical data and analyst forecasts only using an unbiased methodology and our articles are not intended to be financial advice. It does not constitute a recommendation to buy or sell any stock, and does not take account of your objectives, or your financial situation. We aim to bring you long-term focused analysis driven by fundamental data. Note that our analysis may not factor in the latest price-sensitive company announcements or qualitative material. Simply Wall St has no position in any stocks mentioned.
About SZSE:300400
Shenzhen JT Automation EquipmentLtd
Engages in the research and development, production, and sale of intelligent equipment and manufacturing systems.
Flawless balance sheet slight.

