Can Shenzhen Riland Industry Group Co., Ltd's (SZSE:300154) Weak Financials Pull The Plug On The Stock's Current Momentum On Its Share Price?


Shenzhen Riland Industry Group (SZSE:300154) has had a great run on the share market with its stock up by a significant 12% over the last week. We, however wanted to have a closer look at its key financial indicators as the markets usually pay for long-term fundamentals, and in this case, they don't look very promising. Particularly, we will be paying attention to Shenzhen Riland Industry Group's ROE today.
Return on equity or ROE is a key measure used to assess how efficiently a company's management is utilizing the company's capital. Put another way, it reveals the company's success at turning shareholder investments into profits.
Check out our latest analysis for Shenzhen Riland Industry Group
How To Calculate Return On Equity?
Return on equity can be calculated by using the formula:
Return on Equity = Net Profit (from continuing operations) ÷ Shareholders' Equity
So, based on the above formula, the ROE for Shenzhen Riland Industry Group is:
4.7% = CN¥82m ÷ CN¥1.7b (Based on the trailing twelve months to June 2024).
The 'return' is the yearly profit. One way to conceptualize this is that for each CN¥1 of shareholders' capital it has, the company made CN¥0.05 in profit.
What Is The Relationship Between ROE And Earnings Growth?
So far, we've learned that ROE is a measure of a company's profitability. We now need to evaluate how much profit the company reinvests or "retains" for future growth which then gives us an idea about the growth potential of the company. Assuming everything else remains unchanged, the higher the ROE and profit retention, the higher the growth rate of a company compared to companies that don't necessarily bear these characteristics.
Shenzhen Riland Industry Group's Earnings Growth And 4.7% ROE
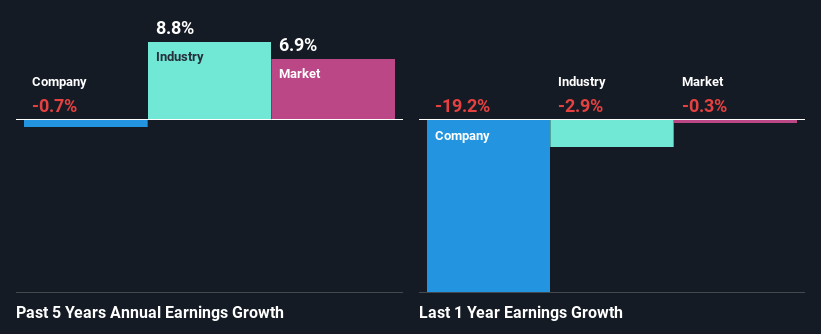
It is quite clear that Shenzhen Riland Industry Group's ROE is rather low. Even compared to the average industry ROE of 7.0%, the company's ROE is quite dismal. Hence, the flat earnings seen by Shenzhen Riland Industry Group over the past five years could probably be the result of it having a lower ROE.
We then compared Shenzhen Riland Industry Group's net income growth with the industry and found that the average industry growth rate was 8.8% in the same 5-year period.
Earnings growth is an important metric to consider when valuing a stock. It’s important for an investor to know whether the market has priced in the company's expected earnings growth (or decline). Doing so will help them establish if the stock's future looks promising or ominous. If you're wondering about Shenzhen Riland Industry Group's's valuation, check out this gauge of its price-to-earnings ratio, as compared to its industry.
Is Shenzhen Riland Industry Group Using Its Retained Earnings Effectively?
Shenzhen Riland Industry Group has a high three-year median payout ratio of 79% (or a retention ratio of 21%), meaning that the company is paying most of its profits as dividends to its shareholders. This does go some way in explaining why there's been no growth in its earnings.
Additionally, Shenzhen Riland Industry Group has paid dividends over a period of at least ten years, which means that the company's management is determined to pay dividends even if it means little to no earnings growth.
Conclusion
Overall, we would be extremely cautious before making any decision on Shenzhen Riland Industry Group. The company has seen a lack of earnings growth as a result of retaining very little profits and whatever little it does retain, is being reinvested at a very low rate of return. Up till now, we've only made a short study of the company's growth data. To gain further insights into Shenzhen Riland Industry Group's past profit growth, check out this visualization of past earnings, revenue and cash flows.
New: Manage All Your Stock Portfolios in One Place
We've created the ultimate portfolio companion for stock investors, and it's free.
• Connect an unlimited number of Portfolios and see your total in one currency
• Be alerted to new Warning Signs or Risks via email or mobile
• Track the Fair Value of your stocks
Have feedback on this article? Concerned about the content? Get in touch with us directly. Alternatively, email editorial-team (at) simplywallst.com.
This article by Simply Wall St is general in nature. We provide commentary based on historical data and analyst forecasts only using an unbiased methodology and our articles are not intended to be financial advice. It does not constitute a recommendation to buy or sell any stock, and does not take account of your objectives, or your financial situation. We aim to bring you long-term focused analysis driven by fundamental data. Note that our analysis may not factor in the latest price-sensitive company announcements or qualitative material. Simply Wall St has no position in any stocks mentioned.
About SZSE:300154
Shenzhen Riland Industry Group
Researches and develops, manufactures, sells, and services inverter welding and cutting equipment, welding automated devices, welding accessories, and protective articles worldwide.
Excellent balance sheet second-rate dividend payer.

