Shouhang High-Tech Energy Co., Ltd. (SZSE:002665) Shares May Have Slumped 26% But Getting In Cheap Is Still Unlikely


Shouhang High-Tech Energy Co., Ltd. (SZSE:002665) shareholders won't be pleased to see that the share price has had a very rough month, dropping 26% and undoing the prior period's positive performance. The recent drop completes a disastrous twelve months for shareholders, who are sitting on a 55% loss during that time.
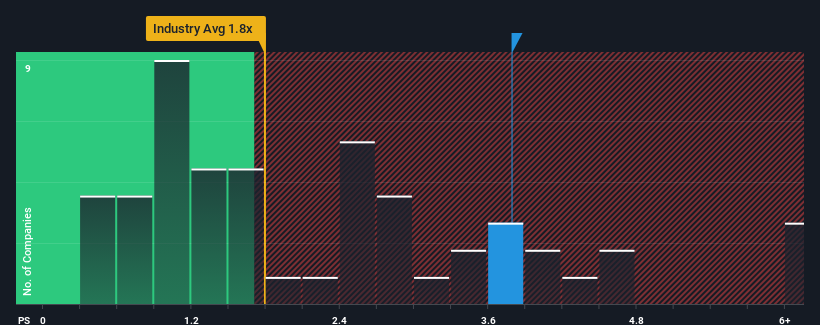
In spite of the heavy fall in price, you could still be forgiven for thinking Shouhang High-Tech Energy is a stock to steer clear of with a price-to-sales ratios (or "P/S") of 3.8x, considering almost half the companies in China's Building industry have P/S ratios below 1.8x. However, the P/S might be quite high for a reason and it requires further investigation to determine if it's justified.
Check out our latest analysis for Shouhang High-Tech Energy
What Does Shouhang High-Tech Energy's P/S Mean For Shareholders?
With revenue growth that's exceedingly strong of late, Shouhang High-Tech Energy has been doing very well. The P/S ratio is probably high because investors think this strong revenue growth will be enough to outperform the broader industry in the near future. However, if this isn't the case, investors might get caught out paying too much for the stock.
Want the full picture on earnings, revenue and cash flow for the company? Then our free report on Shouhang High-Tech Energy will help you shine a light on its historical performance.How Is Shouhang High-Tech Energy's Revenue Growth Trending?
Shouhang High-Tech Energy's P/S ratio would be typical for a company that's expected to deliver very strong growth, and importantly, perform much better than the industry.
If we review the last year of revenue growth, the company posted a terrific increase of 48%. The latest three year period has also seen an excellent 35% overall rise in revenue, aided by its short-term performance. Therefore, it's fair to say the revenue growth recently has been superb for the company.
Comparing the recent medium-term revenue trends against the industry's one-year growth forecast of 19% shows it's noticeably less attractive.
With this information, we find it concerning that Shouhang High-Tech Energy is trading at a P/S higher than the industry. It seems most investors are ignoring the fairly limited recent growth rates and are hoping for a turnaround in the company's business prospects. Only the boldest would assume these prices are sustainable as a continuation of recent revenue trends is likely to weigh heavily on the share price eventually.
The Bottom Line On Shouhang High-Tech Energy's P/S
Even after such a strong price drop, Shouhang High-Tech Energy's P/S still exceeds the industry median significantly. Generally, our preference is to limit the use of the price-to-sales ratio to establishing what the market thinks about the overall health of a company.
The fact that Shouhang High-Tech Energy currently trades on a higher P/S relative to the industry is an oddity, since its recent three-year growth is lower than the wider industry forecast. When we observe slower-than-industry revenue growth alongside a high P/S ratio, we assume there to be a significant risk of the share price decreasing, which would result in a lower P/S ratio. Unless there is a significant improvement in the company's medium-term performance, it will be difficult to prevent the P/S ratio from declining to a more reasonable level.
A lot of potential risks can sit within a company's balance sheet. You can assess many of the main risks through our free balance sheet analysis for Shouhang High-Tech Energy with six simple checks.
If strong companies turning a profit tickle your fancy, then you'll want to check out this free list of interesting companies that trade on a low P/E (but have proven they can grow earnings).
New: Manage All Your Stock Portfolios in One Place
We've created the ultimate portfolio companion for stock investors, and it's free.
• Connect an unlimited number of Portfolios and see your total in one currency
• Be alerted to new Warning Signs or Risks via email or mobile
• Track the Fair Value of your stocks
Have feedback on this article? Concerned about the content? Get in touch with us directly. Alternatively, email editorial-team (at) simplywallst.com.
This article by Simply Wall St is general in nature. We provide commentary based on historical data and analyst forecasts only using an unbiased methodology and our articles are not intended to be financial advice. It does not constitute a recommendation to buy or sell any stock, and does not take account of your objectives, or your financial situation. We aim to bring you long-term focused analysis driven by fundamental data. Note that our analysis may not factor in the latest price-sensitive company announcements or qualitative material. Simply Wall St has no position in any stocks mentioned.
About SZSE:002665
Shouhang High-Tech Energy
Engages in the design, manufacture, and sale of power station air-cooling systems in the People’s Republic of China and internationally.
Flawless balance sheet and slightly overvalued.

