Shenzhen Xinyuren Technology Co., Ltd.'s (SHSE:688573) Stock Is Going Strong: Have Financials A Role To Play?


Shenzhen Xinyuren Technology's (SHSE:688573) stock is up by a considerable 19% over the past week. We wonder if and what role the company's financials play in that price change as a company's long-term fundamentals usually dictate market outcomes. Specifically, we decided to study Shenzhen Xinyuren Technology's ROE in this article.
Return on Equity or ROE is a test of how effectively a company is growing its value and managing investors’ money. In simpler terms, it measures the profitability of a company in relation to shareholder's equity.
Check out our latest analysis for Shenzhen Xinyuren Technology
How To Calculate Return On Equity?
The formula for return on equity is:
Return on Equity = Net Profit (from continuing operations) ÷ Shareholders' Equity
So, based on the above formula, the ROE for Shenzhen Xinyuren Technology is:
5.2% = CN¥47m ÷ CN¥902m (Based on the trailing twelve months to March 2024).
The 'return' is the amount earned after tax over the last twelve months. Another way to think of that is that for every CN¥1 worth of equity, the company was able to earn CN¥0.05 in profit.
What Has ROE Got To Do With Earnings Growth?
Thus far, we have learned that ROE measures how efficiently a company is generating its profits. Based on how much of its profits the company chooses to reinvest or "retain", we are then able to evaluate a company's future ability to generate profits. Assuming all else is equal, companies that have both a higher return on equity and higher profit retention are usually the ones that have a higher growth rate when compared to companies that don't have the same features.
Shenzhen Xinyuren Technology's Earnings Growth And 5.2% ROE
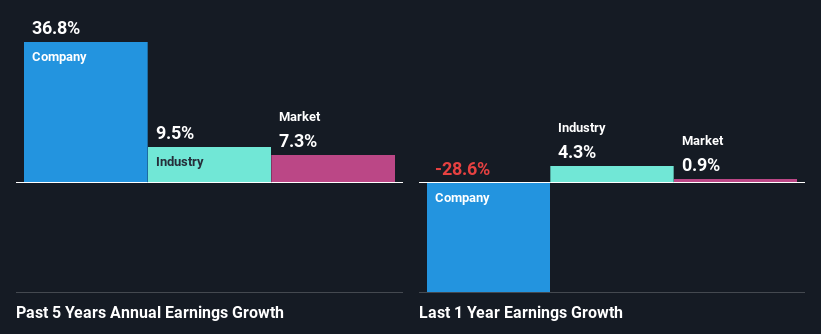
On the face of it, Shenzhen Xinyuren Technology's ROE is not much to talk about. A quick further study shows that the company's ROE doesn't compare favorably to the industry average of 6.9% either. In spite of this, Shenzhen Xinyuren Technology was able to grow its net income considerably, at a rate of 37% in the last five years. We reckon that there could be other factors at play here. For example, it is possible that the company's management has made some good strategic decisions, or that the company has a low payout ratio.
As a next step, we compared Shenzhen Xinyuren Technology's net income growth with the industry, and pleasingly, we found that the growth seen by the company is higher than the average industry growth of 9.5%.
Earnings growth is an important metric to consider when valuing a stock. What investors need to determine next is if the expected earnings growth, or the lack of it, is already built into the share price. By doing so, they will have an idea if the stock is headed into clear blue waters or if swampy waters await. Is Shenzhen Xinyuren Technology fairly valued compared to other companies? These 3 valuation measures might help you decide.
Is Shenzhen Xinyuren Technology Using Its Retained Earnings Effectively?
The three-year median payout ratio for Shenzhen Xinyuren Technology is 32%, which is moderately low. The company is retaining the remaining 68%. By the looks of it, the dividend is well covered and Shenzhen Xinyuren Technology is reinvesting its profits efficiently as evidenced by its exceptional growth which we discussed above.
Conclusion
In total, it does look like Shenzhen Xinyuren Technology has some positive aspects to its business. Despite its low rate of return, the fact that the company reinvests a very high portion of its profits into its business, no doubt contributed to its high earnings growth. While we won't completely dismiss the company, what we would do, is try to ascertain how risky the business is to make a more informed decision around the company. Our risks dashboard would have the 3 risks we have identified for Shenzhen Xinyuren Technology.
New: Manage All Your Stock Portfolios in One Place
We've created the ultimate portfolio companion for stock investors, and it's free.
• Connect an unlimited number of Portfolios and see your total in one currency
• Be alerted to new Warning Signs or Risks via email or mobile
• Track the Fair Value of your stocks
Have feedback on this article? Concerned about the content? Get in touch with us directly. Alternatively, email editorial-team (at) simplywallst.com.
This article by Simply Wall St is general in nature. We provide commentary based on historical data and analyst forecasts only using an unbiased methodology and our articles are not intended to be financial advice. It does not constitute a recommendation to buy or sell any stock, and does not take account of your objectives, or your financial situation. We aim to bring you long-term focused analysis driven by fundamental data. Note that our analysis may not factor in the latest price-sensitive company announcements or qualitative material. Simply Wall St has no position in any stocks mentioned.
Have feedback on this article? Concerned about the content? Get in touch with us directly. Alternatively, email editorial-team@simplywallst.com
About SHSE:688573
Shenzhen Xinyuren Technology
Engages in the research and development, production, and sale of lithium-ion battery production equipment and related components, and other automation equipment in China.
Mediocre balance sheet low.

