Is Power HF Co., Ltd.'s (SHSE:605100) Recent Price Movement Underpinned By Its Weak Fundamentals?


Power HF (SHSE:605100) has had a rough month with its share price down 17%. It seems that the market might have completely ignored the positive aspects of the company's fundamentals and decided to weigh-in more on the negative aspects. Fundamentals usually dictate market outcomes so it makes sense to study the company's financials. In this article, we decided to focus on Power HF's ROE.
Return on Equity or ROE is a test of how effectively a company is growing its value and managing investors’ money. In short, ROE shows the profit each dollar generates with respect to its shareholder investments.
View our latest analysis for Power HF
How To Calculate Return On Equity?
The formula for ROE is:
Return on Equity = Net Profit (from continuing operations) ÷ Shareholders' Equity
So, based on the above formula, the ROE for Power HF is:
5.4% = CN¥103m ÷ CN¥1.9b (Based on the trailing twelve months to March 2024).
The 'return' is the profit over the last twelve months. So, this means that for every CN¥1 of its shareholder's investments, the company generates a profit of CN¥0.05.
What Has ROE Got To Do With Earnings Growth?
So far, we've learned that ROE is a measure of a company's profitability. Depending on how much of these profits the company reinvests or "retains", and how effectively it does so, we are then able to assess a company’s earnings growth potential. Generally speaking, other things being equal, firms with a high return on equity and profit retention, have a higher growth rate than firms that don’t share these attributes.
Power HF's Earnings Growth And 5.4% ROE
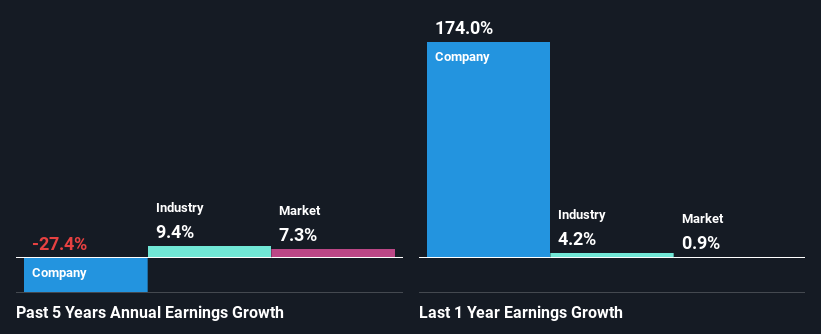
On the face of it, Power HF's ROE is not much to talk about. A quick further study shows that the company's ROE doesn't compare favorably to the industry average of 6.8% either. For this reason, Power HF's five year net income decline of 27% is not surprising given its lower ROE. However, there could also be other factors causing the earnings to decline. For instance, the company has a very high payout ratio, or is faced with competitive pressures.
So, as a next step, we compared Power HF's performance against the industry and were disappointed to discover that while the company has been shrinking its earnings, the industry has been growing its earnings at a rate of 9.4% over the last few years.
Earnings growth is a huge factor in stock valuation. It’s important for an investor to know whether the market has priced in the company's expected earnings growth (or decline). By doing so, they will have an idea if the stock is headed into clear blue waters or if swampy waters await. Is Power HF fairly valued compared to other companies? These 3 valuation measures might help you decide.
Is Power HF Using Its Retained Earnings Effectively?
In spite of a normal three-year median payout ratio of 48% (that is, a retention ratio of 52%), the fact that Power HF's earnings have shrunk is quite puzzling. It looks like there might be some other reasons to explain the lack in that respect. For example, the business could be in decline.
Moreover, Power HF has been paying dividends for three years, which is a considerable amount of time, suggesting that management must have perceived that the shareholders prefer consistent dividends even though earnings have been shrinking.
Summary
Overall, we have mixed feelings about Power HF. While the company does have a high rate of reinvestment, the low ROE means that all that reinvestment is not reaping any benefit to its investors, and moreover, its having a negative impact on the earnings growth. Wrapping up, we would proceed with caution with this company and one way of doing that would be to look at the risk profile of the business. You can see the 4 risks we have identified for Power HF by visiting our risks dashboard for free on our platform here.
New: Manage All Your Stock Portfolios in One Place
We've created the ultimate portfolio companion for stock investors, and it's free.
• Connect an unlimited number of Portfolios and see your total in one currency
• Be alerted to new Warning Signs or Risks via email or mobile
• Track the Fair Value of your stocks
Have feedback on this article? Concerned about the content? Get in touch with us directly. Alternatively, email editorial-team (at) simplywallst.com.
This article by Simply Wall St is general in nature. We provide commentary based on historical data and analyst forecasts only using an unbiased methodology and our articles are not intended to be financial advice. It does not constitute a recommendation to buy or sell any stock, and does not take account of your objectives, or your financial situation. We aim to bring you long-term focused analysis driven by fundamental data. Note that our analysis may not factor in the latest price-sensitive company announcements or qualitative material. Simply Wall St has no position in any stocks mentioned.
About SHSE:605100
Power HF
Researches and develops, manufactures, and sells diesel engines in China and internationally.
Excellent balance sheet with acceptable track record.
