The total return for Jack TechnologyLtd (SHSE:603337) investors has risen faster than earnings growth over the last year


These days it's easy to simply buy an index fund, and your returns should (roughly) match the market. But you can significantly boost your returns by picking above-average stocks. To wit, the Jack Technology Co.,Ltd (SHSE:603337) share price is 50% higher than it was a year ago, much better than the market decline of around 10% (not including dividends) in the same period. That's a solid performance by our standards! In contrast, the longer term returns are negative, since the share price is 5.0% lower than it was three years ago.
Since the long term performance has been good but there's been a recent pullback of 5.9%, let's check if the fundamentals match the share price.
Check out our latest analysis for Jack TechnologyLtd
While the efficient markets hypothesis continues to be taught by some, it has been proven that markets are over-reactive dynamic systems, and investors are not always rational. One imperfect but simple way to consider how the market perception of a company has shifted is to compare the change in the earnings per share (EPS) with the share price movement.
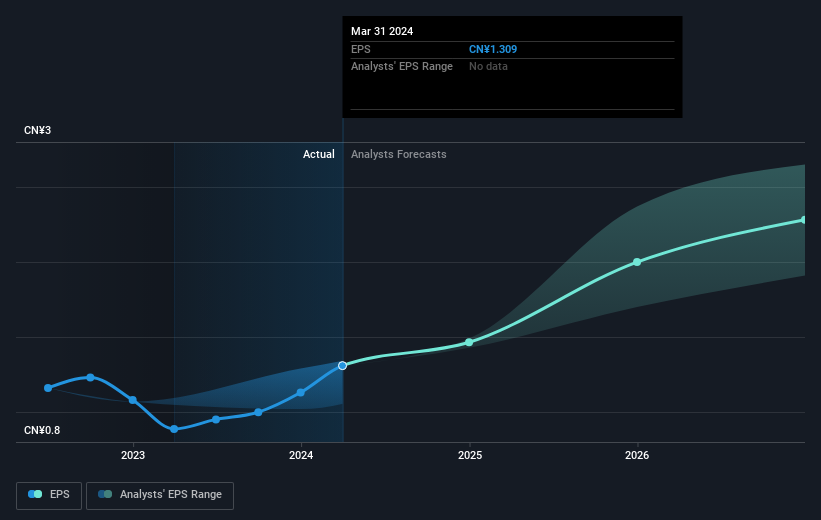
Jack TechnologyLtd was able to grow EPS by 48% in the last twelve months. The similarity between the EPS growth and the 50% share price gain really stands out. So this implies that investor expectations of the company have remained pretty steady. We don't think its coincidental that the share price is growing at a similar rate to the earnings per share.
The company's earnings per share (over time) is depicted in the image below (click to see the exact numbers).
We know that Jack TechnologyLtd has improved its bottom line lately, but is it going to grow revenue? This free report showing analyst revenue forecasts should help you figure out if the EPS growth can be sustained.
What About Dividends?
As well as measuring the share price return, investors should also consider the total shareholder return (TSR). The TSR incorporates the value of any spin-offs or discounted capital raisings, along with any dividends, based on the assumption that the dividends are reinvested. Arguably, the TSR gives a more comprehensive picture of the return generated by a stock. In the case of Jack TechnologyLtd, it has a TSR of 53% for the last 1 year. That exceeds its share price return that we previously mentioned. This is largely a result of its dividend payments!
A Different Perspective
We're pleased to report that Jack TechnologyLtd shareholders have received a total shareholder return of 53% over one year. That's including the dividend. Since the one-year TSR is better than the five-year TSR (the latter coming in at 7% per year), it would seem that the stock's performance has improved in recent times. In the best case scenario, this may hint at some real business momentum, implying that now could be a great time to delve deeper. While it is well worth considering the different impacts that market conditions can have on the share price, there are other factors that are even more important. Consider for instance, the ever-present spectre of investment risk. We've identified 1 warning sign with Jack TechnologyLtd , and understanding them should be part of your investment process.
If you would prefer to check out another company -- one with potentially superior financials -- then do not miss this free list of companies that have proven they can grow earnings.
Please note, the market returns quoted in this article reflect the market weighted average returns of stocks that currently trade on Chinese exchanges.
New: Manage All Your Stock Portfolios in One Place
We've created the ultimate portfolio companion for stock investors, and it's free.
• Connect an unlimited number of Portfolios and see your total in one currency
• Be alerted to new Warning Signs or Risks via email or mobile
• Track the Fair Value of your stocks
Have feedback on this article? Concerned about the content? Get in touch with us directly. Alternatively, email editorial-team (at) simplywallst.com.
This article by Simply Wall St is general in nature. We provide commentary based on historical data and analyst forecasts only using an unbiased methodology and our articles are not intended to be financial advice. It does not constitute a recommendation to buy or sell any stock, and does not take account of your objectives, or your financial situation. We aim to bring you long-term focused analysis driven by fundamental data. Note that our analysis may not factor in the latest price-sensitive company announcements or qualitative material. Simply Wall St has no position in any stocks mentioned.
About SHSE:603337
Jack TechnologyLtd
Engages in the production and sale of sewing machines in China and internationally.
Undervalued with solid track record.
