Zhuzhou Kibing Group Co.,Ltd (SHSE:601636) Stock Has Shown Weakness Lately But Financials Look Strong: Should Prospective Shareholders Make The Leap?


It is hard to get excited after looking at Zhuzhou Kibing GroupLtd's (SHSE:601636) recent performance, when its stock has declined 22% over the past three months. However, a closer look at its sound financials might cause you to think again. Given that fundamentals usually drive long-term market outcomes, the company is worth looking at. Particularly, we will be paying attention to Zhuzhou Kibing GroupLtd's ROE today.
ROE or return on equity is a useful tool to assess how effectively a company can generate returns on the investment it received from its shareholders. In short, ROE shows the profit each dollar generates with respect to its shareholder investments.
View our latest analysis for Zhuzhou Kibing GroupLtd
How Is ROE Calculated?
The formula for ROE is:
Return on Equity = Net Profit (from continuing operations) ÷ Shareholders' Equity
So, based on the above formula, the ROE for Zhuzhou Kibing GroupLtd is:
14% = CN¥2.1b ÷ CN¥15b (Based on the trailing twelve months to March 2024).
The 'return' is the yearly profit. That means that for every CN¥1 worth of shareholders' equity, the company generated CN¥0.14 in profit.
Why Is ROE Important For Earnings Growth?
We have already established that ROE serves as an efficient profit-generating gauge for a company's future earnings. We now need to evaluate how much profit the company reinvests or "retains" for future growth which then gives us an idea about the growth potential of the company. Assuming everything else remains unchanged, the higher the ROE and profit retention, the higher the growth rate of a company compared to companies that don't necessarily bear these characteristics.
Zhuzhou Kibing GroupLtd's Earnings Growth And 14% ROE
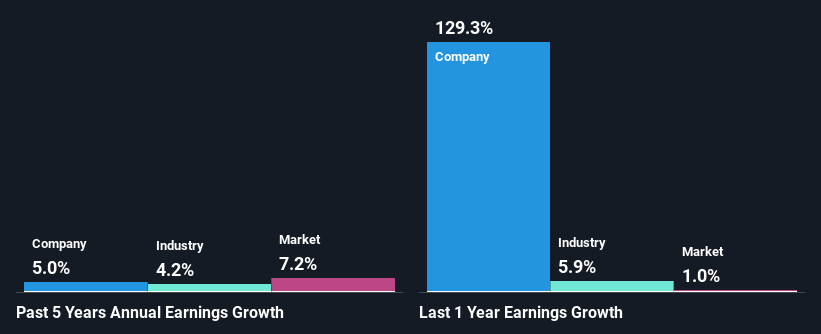
To begin with, Zhuzhou Kibing GroupLtd seems to have a respectable ROE. Further, the company's ROE compares quite favorably to the industry average of 8.3%. This probably laid the ground for Zhuzhou Kibing GroupLtd's moderate 5.0% net income growth seen over the past five years.
We then performed a comparison between Zhuzhou Kibing GroupLtd's net income growth with the industry, which revealed that the company's growth is similar to the average industry growth of 4.2% in the same 5-year period.
Earnings growth is an important metric to consider when valuing a stock. It’s important for an investor to know whether the market has priced in the company's expected earnings growth (or decline). Doing so will help them establish if the stock's future looks promising or ominous. One good indicator of expected earnings growth is the P/E ratio which determines the price the market is willing to pay for a stock based on its earnings prospects. So, you may want to check if Zhuzhou Kibing GroupLtd is trading on a high P/E or a low P/E, relative to its industry.
Is Zhuzhou Kibing GroupLtd Using Its Retained Earnings Effectively?
While Zhuzhou Kibing GroupLtd has a three-year median payout ratio of 51% (which means it retains 49% of profits), the company has still seen a fair bit of earnings growth in the past, meaning that its high payout ratio hasn't hampered its ability to grow.
Besides, Zhuzhou Kibing GroupLtd has been paying dividends for at least ten years or more. This shows that the company is committed to sharing profits with its shareholders.
Summary
Overall, we are quite pleased with Zhuzhou Kibing GroupLtd's performance. In particular, its high ROE is quite noteworthy and also the probable explanation behind its considerable earnings growth. Yet, the company is retaining a small portion of its profits. Which means that the company has been able to grow its earnings in spite of it, so that's not too bad. That being so, the latest analyst forecasts show that the company will continue to see an expansion in its earnings. To know more about the latest analysts predictions for the company, check out this visualization of analyst forecasts for the company.
Valuation is complex, but we're here to simplify it.
Discover if Zhuzhou Kibing GroupLtd might be undervalued or overvalued with our detailed analysis, featuring fair value estimates, potential risks, dividends, insider trades, and its financial condition.
Access Free AnalysisHave feedback on this article? Concerned about the content? Get in touch with us directly. Alternatively, email editorial-team (at) simplywallst.com.
This article by Simply Wall St is general in nature. We provide commentary based on historical data and analyst forecasts only using an unbiased methodology and our articles are not intended to be financial advice. It does not constitute a recommendation to buy or sell any stock, and does not take account of your objectives, or your financial situation. We aim to bring you long-term focused analysis driven by fundamental data. Note that our analysis may not factor in the latest price-sensitive company announcements or qualitative material. Simply Wall St has no position in any stocks mentioned.
Have feedback on this article? Concerned about the content? Get in touch with us directly. Alternatively, email editorial-team@simplywallst.com
About SHSE:601636
Undervalued with proven track record and pays a dividend.
