Stock Analysis
Investors in Zhuzhou Kibing GroupLtd (SHSE:601636) have seen strong returns of 123% over the past five years

Stock pickers are generally looking for stocks that will outperform the broader market. And the truth is, you can make significant gains if you buy good quality businesses at the right price. For example, the Zhuzhou Kibing Group Co.,Ltd (SHSE:601636) share price is up 73% in the last 5 years, clearly besting the market decline of around 2.7% (ignoring dividends).
Now it's worth having a look at the company's fundamentals too, because that will help us determine if the long term shareholder return has matched the performance of the underlying business.
See our latest analysis for Zhuzhou Kibing GroupLtd
While the efficient markets hypothesis continues to be taught by some, it has been proven that markets are over-reactive dynamic systems, and investors are not always rational. One imperfect but simple way to consider how the market perception of a company has shifted is to compare the change in the earnings per share (EPS) with the share price movement.
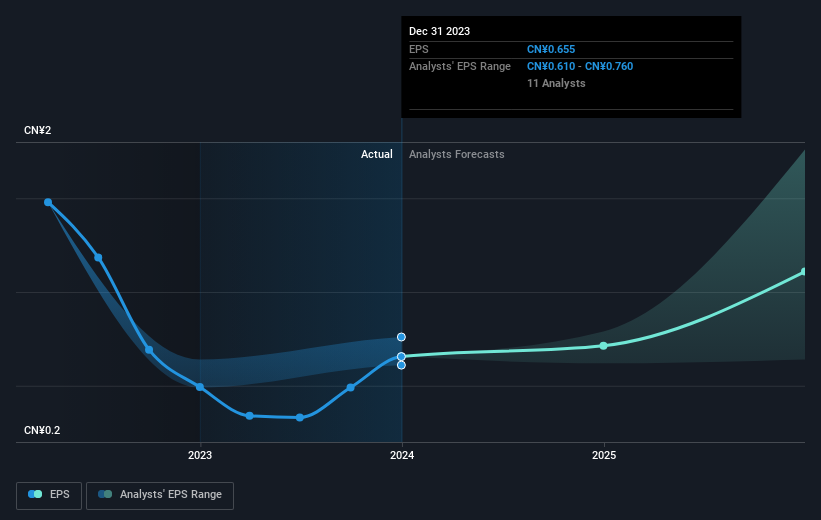
During five years of share price growth, Zhuzhou Kibing GroupLtd achieved compound earnings per share (EPS) growth of 7.4% per year. This EPS growth is lower than the 12% average annual increase in the share price. This suggests that market participants hold the company in higher regard, these days. And that's hardly shocking given the track record of growth.
You can see how EPS has changed over time in the image below (click on the chart to see the exact values).
We know that Zhuzhou Kibing GroupLtd has improved its bottom line lately, but is it going to grow revenue? If you're interested, you could check this free report showing consensus revenue forecasts.
What About Dividends?
When looking at investment returns, it is important to consider the difference between total shareholder return (TSR) and share price return. The TSR incorporates the value of any spin-offs or discounted capital raisings, along with any dividends, based on the assumption that the dividends are reinvested. It's fair to say that the TSR gives a more complete picture for stocks that pay a dividend. As it happens, Zhuzhou Kibing GroupLtd's TSR for the last 5 years was 123%, which exceeds the share price return mentioned earlier. The dividends paid by the company have thusly boosted the total shareholder return.
A Different Perspective
We regret to report that Zhuzhou Kibing GroupLtd shareholders are down 31% for the year (even including dividends). Unfortunately, that's worse than the broader market decline of 16%. However, it could simply be that the share price has been impacted by broader market jitters. It might be worth keeping an eye on the fundamentals, in case there's a good opportunity. Longer term investors wouldn't be so upset, since they would have made 17%, each year, over five years. If the fundamental data continues to indicate long term sustainable growth, the current sell-off could be an opportunity worth considering. It's always interesting to track share price performance over the longer term. But to understand Zhuzhou Kibing GroupLtd better, we need to consider many other factors. For instance, we've identified 2 warning signs for Zhuzhou Kibing GroupLtd (1 doesn't sit too well with us) that you should be aware of.
Of course Zhuzhou Kibing GroupLtd may not be the best stock to buy. So you may wish to see this free collection of growth stocks.
Please note, the market returns quoted in this article reflect the market weighted average returns of stocks that currently trade on Chinese exchanges.
Valuation is complex, but we're helping make it simple.
Find out whether Zhuzhou Kibing GroupLtd is potentially over or undervalued by checking out our comprehensive analysis, which includes fair value estimates, risks and warnings, dividends, insider transactions and financial health.
View the Free AnalysisHave feedback on this article? Concerned about the content? Get in touch with us directly. Alternatively, email editorial-team (at) simplywallst.com.
This article by Simply Wall St is general in nature. We provide commentary based on historical data and analyst forecasts only using an unbiased methodology and our articles are not intended to be financial advice. It does not constitute a recommendation to buy or sell any stock, and does not take account of your objectives, or your financial situation. We aim to bring you long-term focused analysis driven by fundamental data. Note that our analysis may not factor in the latest price-sensitive company announcements or qualitative material. Simply Wall St has no position in any stocks mentioned.
About SHSE:601636
Zhuzhou Kibing GroupLtd
Zhuzhou Kibing Group Co.,Ltd manufactures and sells glass in China.
Proven track record average dividend payer.
