- China
- /
- Electrical
- /
- SHSE:600517
State Grid Yingda Co.,Ltd. (SHSE:600517) On An Uptrend: Could Fundamentals Be Driving The Stock?


State Grid YingdaLtd's (SHSE:600517) stock is up by 1.9% over the past week. We wonder if and what role the company's financials play in that price change as a company's long-term fundamentals usually dictate market outcomes. In this article, we decided to focus on State Grid YingdaLtd's ROE.
Return on equity or ROE is a key measure used to assess how efficiently a company's management is utilizing the company's capital. In simpler terms, it measures the profitability of a company in relation to shareholder's equity.
View our latest analysis for State Grid YingdaLtd
How To Calculate Return On Equity?
The formula for ROE is:
Return on Equity = Net Profit (from continuing operations) ÷ Shareholders' Equity
So, based on the above formula, the ROE for State Grid YingdaLtd is:
7.2% = CN¥1.7b ÷ CN¥24b (Based on the trailing twelve months to March 2024).
The 'return' is the profit over the last twelve months. That means that for every CN¥1 worth of shareholders' equity, the company generated CN¥0.07 in profit.
What Is The Relationship Between ROE And Earnings Growth?
So far, we've learned that ROE is a measure of a company's profitability. Depending on how much of these profits the company reinvests or "retains", and how effectively it does so, we are then able to assess a company’s earnings growth potential. Generally speaking, other things being equal, firms with a high return on equity and profit retention, have a higher growth rate than firms that don’t share these attributes.
State Grid YingdaLtd's Earnings Growth And 7.2% ROE
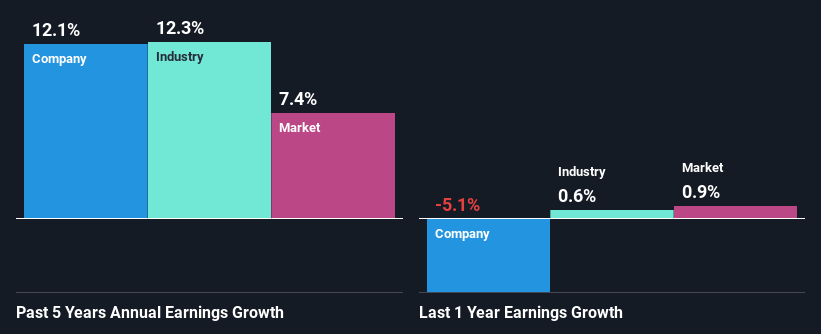
When you first look at it, State Grid YingdaLtd's ROE doesn't look that attractive. However, its ROE is similar to the industry average of 6.9%, so we won't completely dismiss the company. Having said that, State Grid YingdaLtd has shown a modest net income growth of 12% over the past five years. Given the slightly low ROE, it is likely that there could be some other aspects that are driving this growth. Such as - high earnings retention or an efficient management in place.
As a next step, we compared State Grid YingdaLtd's net income growth with the industry and found that the company has a similar growth figure when compared with the industry average growth rate of 12% in the same period.
The basis for attaching value to a company is, to a great extent, tied to its earnings growth. It’s important for an investor to know whether the market has priced in the company's expected earnings growth (or decline). Doing so will help them establish if the stock's future looks promising or ominous. One good indicator of expected earnings growth is the P/E ratio which determines the price the market is willing to pay for a stock based on its earnings prospects. So, you may want to check if State Grid YingdaLtd is trading on a high P/E or a low P/E, relative to its industry.
Is State Grid YingdaLtd Efficiently Re-investing Its Profits?
State Grid YingdaLtd has a three-year median payout ratio of 30%, which implies that it retains the remaining 70% of its profits. This suggests that its dividend is well covered, and given the decent growth seen by the company, it looks like management is reinvesting its earnings efficiently.
Moreover, State Grid YingdaLtd is determined to keep sharing its profits with shareholders which we infer from its long history of paying a dividend for at least ten years.
Summary
In total, it does look like State Grid YingdaLtd has some positive aspects to its business. Even in spite of the low rate of return, the company has posted impressive earnings growth as a result of reinvesting heavily into its business. While we won't completely dismiss the company, what we would do, is try to ascertain how risky the business is to make a more informed decision around the company. To know the 1 risk we have identified for State Grid YingdaLtd visit our risks dashboard for free.
New: Manage All Your Stock Portfolios in One Place
We've created the ultimate portfolio companion for stock investors, and it's free.
• Connect an unlimited number of Portfolios and see your total in one currency
• Be alerted to new Warning Signs or Risks via email or mobile
• Track the Fair Value of your stocks
Have feedback on this article? Concerned about the content? Get in touch with us directly. Alternatively, email editorial-team (at) simplywallst.com.
This article by Simply Wall St is general in nature. We provide commentary based on historical data and analyst forecasts only using an unbiased methodology and our articles are not intended to be financial advice. It does not constitute a recommendation to buy or sell any stock, and does not take account of your objectives, or your financial situation. We aim to bring you long-term focused analysis driven by fundamental data. Note that our analysis may not factor in the latest price-sensitive company announcements or qualitative material. Simply Wall St has no position in any stocks mentioned.
About SHSE:600517
State Grid YingdaLtd
Engages in the electrical, trust, securities, futures, and carbon asset businesses in China.
Excellent balance sheet and slightly overvalued.
