- China
- /
- Construction
- /
- SHSE:600039
Sichuan Road & Bridge GroupLtd's (SHSE:600039) five-year total shareholder returns outpace the underlying earnings growth


The Sichuan Road & Bridge Group Co.,Ltd (SHSE:600039) share price has had a bad week, falling 11%. But that doesn't change the fact that shareholders have received really good returns over the last five years. In fact, the share price is 222% higher today. We think it's more important to dwell on the long term returns than the short term returns. Of course, that doesn't necessarily mean it's cheap now.
Although Sichuan Road & Bridge GroupLtd has shed CN¥8.1b from its market cap this week, let's take a look at its longer term fundamental trends and see if they've driven returns.
Check out our latest analysis for Sichuan Road & Bridge GroupLtd
There is no denying that markets are sometimes efficient, but prices do not always reflect underlying business performance. One flawed but reasonable way to assess how sentiment around a company has changed is to compare the earnings per share (EPS) with the share price.
Over half a decade, Sichuan Road & Bridge GroupLtd managed to grow its earnings per share at 21% a year. So the EPS growth rate is rather close to the annualized share price gain of 26% per year. This indicates that investor sentiment towards the company has not changed a great deal. Rather, the share price has approximately tracked EPS growth.
You can see below how EPS has changed over time (discover the exact values by clicking on the image).
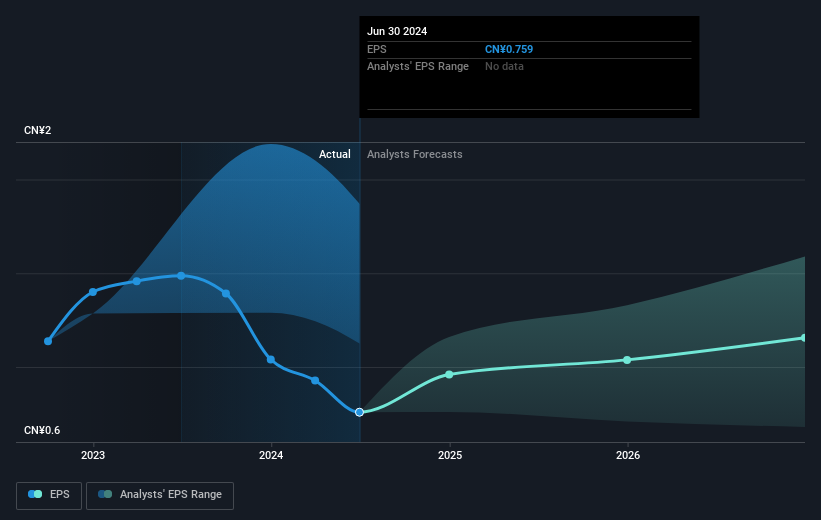
It might be well worthwhile taking a look at our free report on Sichuan Road & Bridge GroupLtd's earnings, revenue and cash flow.
What About Dividends?
When looking at investment returns, it is important to consider the difference between total shareholder return (TSR) and share price return. The TSR is a return calculation that accounts for the value of cash dividends (assuming that any dividend received was reinvested) and the calculated value of any discounted capital raisings and spin-offs. It's fair to say that the TSR gives a more complete picture for stocks that pay a dividend. We note that for Sichuan Road & Bridge GroupLtd the TSR over the last 5 years was 308%, which is better than the share price return mentioned above. This is largely a result of its dividend payments!
A Different Perspective
Sichuan Road & Bridge GroupLtd shareholders gained a total return of 2.8% during the year. But that return falls short of the market. On the bright side, the longer term returns (running at about 32% a year, over half a decade) look better. It may well be that this is a business worth popping on the watching, given the continuing positive reception, over time, from the market. While it is well worth considering the different impacts that market conditions can have on the share price, there are other factors that are even more important. Take risks, for example - Sichuan Road & Bridge GroupLtd has 2 warning signs (and 1 which shouldn't be ignored) we think you should know about.
But note: Sichuan Road & Bridge GroupLtd may not be the best stock to buy. So take a peek at this free list of interesting companies with past earnings growth (and further growth forecast).
Please note, the market returns quoted in this article reflect the market weighted average returns of stocks that currently trade on Chinese exchanges.
New: Manage All Your Stock Portfolios in One Place
We've created the ultimate portfolio companion for stock investors, and it's free.
• Connect an unlimited number of Portfolios and see your total in one currency
• Be alerted to new Warning Signs or Risks via email or mobile
• Track the Fair Value of your stocks
Have feedback on this article? Concerned about the content? Get in touch with us directly. Alternatively, email editorial-team (at) simplywallst.com.
This article by Simply Wall St is general in nature. We provide commentary based on historical data and analyst forecasts only using an unbiased methodology and our articles are not intended to be financial advice. It does not constitute a recommendation to buy or sell any stock, and does not take account of your objectives, or your financial situation. We aim to bring you long-term focused analysis driven by fundamental data. Note that our analysis may not factor in the latest price-sensitive company announcements or qualitative material. Simply Wall St has no position in any stocks mentioned.
About SHSE:600039
Sichuan Road & Bridge GroupLtd
Engages in the investment, development, construction, and operation of engineering construction, mining, clean energy, and new materials in China and internationally.
Adequate balance sheet average dividend payer.
