
Advertisement
- China
- /
- Auto Components
- /
- SHSE:603348
Has Wencan Group Co., Ltd.'s (SHSE:603348) Impressive Stock Performance Got Anything to Do With Its Fundamentals?
Wencan Group's (SHSE:603348) stock is up by a considerable 13% over the past month. As most would know, fundamentals are what usually guide market price movements over the long-term, so we decided to look at the company's key financial indicators today to determine if they have any role to play in the recent price movement. In this article, we decided to focus on Wencan Group's ROE.
Return on Equity or ROE is a test of how effectively a company is growing its value and managing investors’ money. In short, ROE shows the profit each dollar generates with respect to its shareholder investments.
See our latest analysis for Wencan Group
How Is ROE Calculated?
ROE can be calculated by using the formula:
Return on Equity = Net Profit (from continuing operations) ÷ Shareholders' Equity
So, based on the above formula, the ROE for Wencan Group is:
3.7% = CN¥118m ÷ CN¥3.2b (Based on the trailing twelve months to June 2024).
The 'return' refers to a company's earnings over the last year. Another way to think of that is that for every CN¥1 worth of equity, the company was able to earn CN¥0.04 in profit.
Why Is ROE Important For Earnings Growth?
We have already established that ROE serves as an efficient profit-generating gauge for a company's future earnings. Depending on how much of these profits the company reinvests or "retains", and how effectively it does so, we are then able to assess a company’s earnings growth potential. Assuming all else is equal, companies that have both a higher return on equity and higher profit retention are usually the ones that have a higher growth rate when compared to companies that don't have the same features.
Wencan Group's Earnings Growth And 3.7% ROE
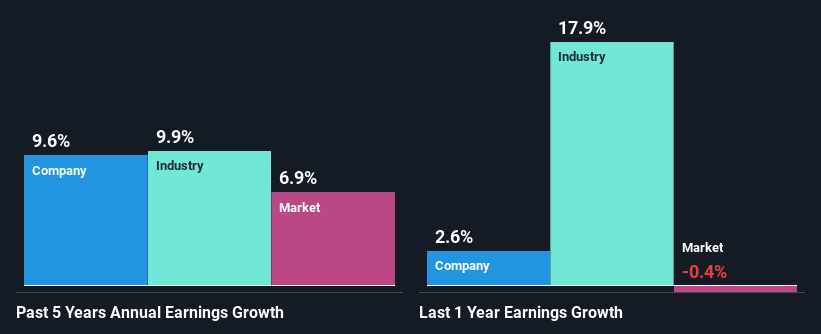
It is hard to argue that Wencan Group's ROE is much good in and of itself. Not just that, even compared to the industry average of 8.5%, the company's ROE is entirely unremarkable. Wencan Group was still able to see a decent net income growth of 9.6% over the past five years. Therefore, the growth in earnings could probably have been caused by other variables. Such as - high earnings retention or an efficient management in place.
We then performed a comparison between Wencan Group's net income growth with the industry, which revealed that the company's growth is similar to the average industry growth of 9.9% in the same 5-year period.
The basis for attaching value to a company is, to a great extent, tied to its earnings growth. It’s important for an investor to know whether the market has priced in the company's expected earnings growth (or decline). Doing so will help them establish if the stock's future looks promising or ominous. One good indicator of expected earnings growth is the P/E ratio which determines the price the market is willing to pay for a stock based on its earnings prospects. So, you may want to check if Wencan Group is trading on a high P/E or a low P/E, relative to its industry.
Is Wencan Group Efficiently Re-investing Its Profits?
Wencan Group has a healthy combination of a moderate three-year median payout ratio of 30% (or a retention ratio of 70%) and a respectable amount of growth in earnings as we saw above, meaning that the company has been making efficient use of its profits.
Additionally, Wencan Group has paid dividends over a period of five years which means that the company is pretty serious about sharing its profits with shareholders. Based on the latest analysts' estimates, we found that the company's future payout ratio over the next three years is expected to hold steady at 27%. However, Wencan Group's ROE is predicted to rise to 11% despite there being no anticipated change in its payout ratio.
Conclusion
Overall, we feel that Wencan Group certainly does have some positive factors to consider. With a high rate of reinvestment, albeit at a low ROE, the company has managed to see a considerable growth in its earnings. With that said, the latest industry analyst forecasts reveal that the company's earnings are expected to accelerate. To know more about the latest analysts predictions for the company, check out this visualization of analyst forecasts for the company.
Valuation is complex, but we're here to simplify it.
Discover if Wencan Group might be undervalued or overvalued with our detailed analysis, featuring fair value estimates, potential risks, dividends, insider trades, and its financial condition.
Access Free AnalysisHave feedback on this article? Concerned about the content? Get in touch with us directly. Alternatively, email editorial-team (at) simplywallst.com.
This article by Simply Wall St is general in nature. We provide commentary based on historical data and analyst forecasts only using an unbiased methodology and our articles are not intended to be financial advice. It does not constitute a recommendation to buy or sell any stock, and does not take account of your objectives, or your financial situation. We aim to bring you long-term focused analysis driven by fundamental data. Note that our analysis may not factor in the latest price-sensitive company announcements or qualitative material. Simply Wall St has no position in any stocks mentioned.
About SHSE:603348
Wencan Group
Engages in the research and development, production, and sale of aluminum aluminum alloy precision castings in China and internationally.
Undervalued with reasonable growth potential.
Market Insights

Advertisement
Community Narratives
The company that turned a verb into a global necessity and basically runs the modern internet, digital ads, smartphones, maps, and AI.
Fair Value US$300.00|7.1% undervalued
OS
Community Contributor
Flowers Foods Pays A Fair Price For Health
Fair Value US$16.12|26.4% undervalued
NV
Community Contributor
TMX Group will thrive with 33.3% profit margin and enduring market moat
Fair Value CA$49.90|0.8% overvalued
LI
Community Contributor
The "Molecular Pencil": Why Beam's Technology is Built to Win
Fair Value US$65.01|65.8% undervalued
DA
Community Contributor