- China
- /
- Auto Components
- /
- SHSE:603197
Shanghai Baolong Automotive (SHSE:603197) sheds 7.7% this week, as yearly returns fall more in line with earnings growth


Some Shanghai Baolong Automotive Corporation (SHSE:603197) shareholders are probably rather concerned to see the share price fall 32% over the last three months. But that doesn't change the fact that the returns over the last five years have been pleasing. After all, the share price is up a market-beating 67% in that time. Unfortunately not all shareholders will have held it for the long term, so spare a thought for those caught in the 49% decline over the last twelve months.
Although Shanghai Baolong Automotive has shed CN¥526m from its market cap this week, let's take a look at its longer term fundamental trends and see if they've driven returns.
See our latest analysis for Shanghai Baolong Automotive
In his essay The Superinvestors of Graham-and-Doddsville Warren Buffett described how share prices do not always rationally reflect the value of a business. By comparing earnings per share (EPS) and share price changes over time, we can get a feel for how investor attitudes to a company have morphed over time.
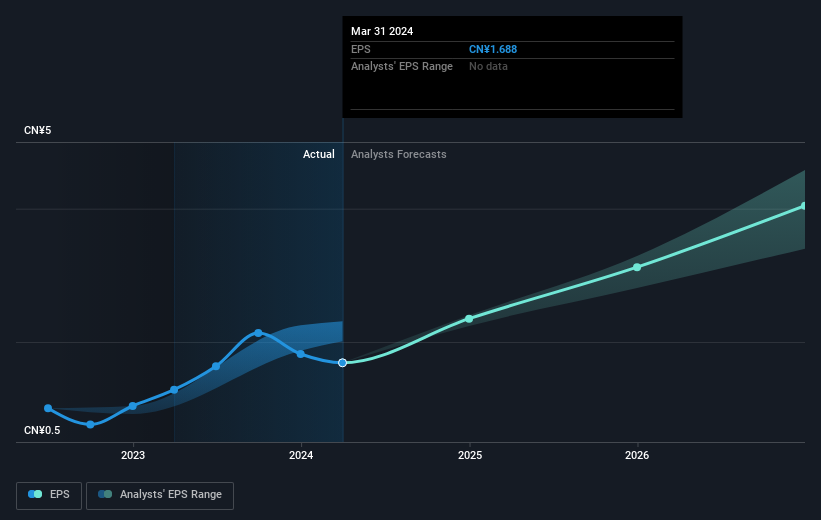
Over half a decade, Shanghai Baolong Automotive managed to grow its earnings per share at 14% a year. The EPS growth is more impressive than the yearly share price gain of 11% over the same period. So it seems the market isn't so enthusiastic about the stock these days.
The company's earnings per share (over time) is depicted in the image below (click to see the exact numbers).
We know that Shanghai Baolong Automotive has improved its bottom line lately, but is it going to grow revenue? If you're interested, you could check this free report showing consensus revenue forecasts.
What About Dividends?
It is important to consider the total shareholder return, as well as the share price return, for any given stock. The TSR incorporates the value of any spin-offs or discounted capital raisings, along with any dividends, based on the assumption that the dividends are reinvested. Arguably, the TSR gives a more comprehensive picture of the return generated by a stock. In the case of Shanghai Baolong Automotive, it has a TSR of 76% for the last 5 years. That exceeds its share price return that we previously mentioned. And there's no prize for guessing that the dividend payments largely explain the divergence!
A Different Perspective
While the broader market lost about 19% in the twelve months, Shanghai Baolong Automotive shareholders did even worse, losing 48% (even including dividends). Having said that, it's inevitable that some stocks will be oversold in a falling market. The key is to keep your eyes on the fundamental developments. Longer term investors wouldn't be so upset, since they would have made 12%, each year, over five years. It could be that the recent sell-off is an opportunity, so it may be worth checking the fundamental data for signs of a long term growth trend. It's always interesting to track share price performance over the longer term. But to understand Shanghai Baolong Automotive better, we need to consider many other factors. To that end, you should learn about the 2 warning signs we've spotted with Shanghai Baolong Automotive (including 1 which can't be ignored) .
Of course Shanghai Baolong Automotive may not be the best stock to buy. So you may wish to see this free collection of growth stocks.
Please note, the market returns quoted in this article reflect the market weighted average returns of stocks that currently trade on Chinese exchanges.
New: Manage All Your Stock Portfolios in One Place
We've created the ultimate portfolio companion for stock investors, and it's free.
• Connect an unlimited number of Portfolios and see your total in one currency
• Be alerted to new Warning Signs or Risks via email or mobile
• Track the Fair Value of your stocks
Have feedback on this article? Concerned about the content? Get in touch with us directly. Alternatively, email editorial-team (at) simplywallst.com.
This article by Simply Wall St is general in nature. We provide commentary based on historical data and analyst forecasts only using an unbiased methodology and our articles are not intended to be financial advice. It does not constitute a recommendation to buy or sell any stock, and does not take account of your objectives, or your financial situation. We aim to bring you long-term focused analysis driven by fundamental data. Note that our analysis may not factor in the latest price-sensitive company announcements or qualitative material. Simply Wall St has no position in any stocks mentioned.
Have feedback on this article? Concerned about the content? Get in touch with us directly. Alternatively, email editorial-team@simplywallst.com
About SHSE:603197
Shanghai Baolong Automotive
Manufactures and sells automotive parts and components.
Very undervalued with high growth potential.
