Stock Analysis
- Switzerland
- /
- Life Sciences
- /
- SWX:TECN
Tecan Group AG's (VTX:TECN) Stock Is Going Strong: Is the Market Following Fundamentals?

Most readers would already be aware that Tecan Group's (VTX:TECN) stock increased significantly by 14% over the past three months. Given that the market rewards strong financials in the long-term, we wonder if that is the case in this instance. Specifically, we decided to study Tecan Group's ROE in this article.
Return on equity or ROE is an important factor to be considered by a shareholder because it tells them how effectively their capital is being reinvested. In simpler terms, it measures the profitability of a company in relation to shareholder's equity.
View our latest analysis for Tecan Group
How To Calculate Return On Equity?
The formula for return on equity is:
Return on Equity = Net Profit (from continuing operations) ÷ Shareholders' Equity
So, based on the above formula, the ROE for Tecan Group is:
8.1% = CHF109m ÷ CHF1.3b (Based on the trailing twelve months to June 2023).
The 'return' is the amount earned after tax over the last twelve months. Another way to think of that is that for every CHF1 worth of equity, the company was able to earn CHF0.08 in profit.
What Is The Relationship Between ROE And Earnings Growth?
So far, we've learned that ROE is a measure of a company's profitability. Depending on how much of these profits the company reinvests or "retains", and how effectively it does so, we are then able to assess a company’s earnings growth potential. Assuming everything else remains unchanged, the higher the ROE and profit retention, the higher the growth rate of a company compared to companies that don't necessarily bear these characteristics.
Tecan Group's Earnings Growth And 8.1% ROE
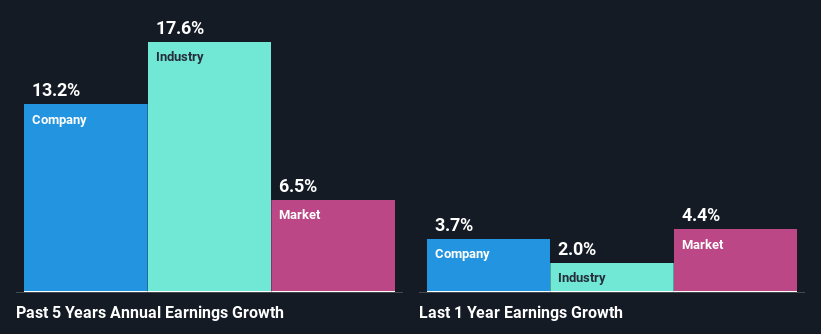
To begin with, Tecan Group seems to have a respectable ROE. And on comparing with the industry, we found that the the average industry ROE is similar at 8.0%. Consequently, this likely laid the ground for the decent growth of 13% seen over the past five years by Tecan Group.
We then compared Tecan Group's net income growth with the industry and found that the company's growth figure is lower than the average industry growth rate of 18% in the same 5-year period, which is a bit concerning.
The basis for attaching value to a company is, to a great extent, tied to its earnings growth. What investors need to determine next is if the expected earnings growth, or the lack of it, is already built into the share price. Doing so will help them establish if the stock's future looks promising or ominous. One good indicator of expected earnings growth is the P/E ratio which determines the price the market is willing to pay for a stock based on its earnings prospects. So, you may want to check if Tecan Group is trading on a high P/E or a low P/E, relative to its industry.
Is Tecan Group Using Its Retained Earnings Effectively?
Tecan Group has a three-year median payout ratio of 30%, which implies that it retains the remaining 70% of its profits. This suggests that its dividend is well covered, and given the decent growth seen by the company, it looks like management is reinvesting its earnings efficiently.
Moreover, Tecan Group is determined to keep sharing its profits with shareholders which we infer from its long history of paying a dividend for at least ten years. Based on the latest analysts' estimates, we found that the company's future payout ratio over the next three years is expected to hold steady at 24%. However, Tecan Group's ROE is predicted to rise to 10% despite there being no anticipated change in its payout ratio.
Summary
In total, we are pretty happy with Tecan Group's performance. Particularly, we like that the company is reinvesting heavily into its business, and at a high rate of return. As a result, the decent growth in its earnings is not surprising. We also studied the latest analyst forecasts and found that the company's earnings growth is expected be similar to its current growth rate. To know more about the latest analysts predictions for the company, check out this visualization of analyst forecasts for the company.
Valuation is complex, but we're helping make it simple.
Find out whether Tecan Group is potentially over or undervalued by checking out our comprehensive analysis, which includes fair value estimates, risks and warnings, dividends, insider transactions and financial health.
View the Free AnalysisHave feedback on this article? Concerned about the content? Get in touch with us directly. Alternatively, email editorial-team (at) simplywallst.com.
This article by Simply Wall St is general in nature. We provide commentary based on historical data and analyst forecasts only using an unbiased methodology and our articles are not intended to be financial advice. It does not constitute a recommendation to buy or sell any stock, and does not take account of your objectives, or your financial situation. We aim to bring you long-term focused analysis driven by fundamental data. Note that our analysis may not factor in the latest price-sensitive company announcements or qualitative material. Simply Wall St has no position in any stocks mentioned.
About SWX:TECN
Tecan Group
Tecan Group AG provides laboratory instruments and solutions for pharmaceutical, biotechnology and in-vitro diagnostic companies, university research departments, and diagnostic and other laboratories.
Excellent balance sheet and good value.

