Stock Analysis
- Switzerland
- /
- Life Sciences
- /
- SWX:SKAN
SKAN Group (VTX:SKAN) stock performs better than its underlying earnings growth over last five years

We think all investors should try to buy and hold high quality multi-year winners. While the best companies are hard to find, but they can generate massive returns over long periods. To wit, the SKAN Group AG (VTX:SKAN) share price has soared 844% over five years. If that doesn't get you thinking about long term investing, we don't know what will. It's even up 4.7% in the last week. The company reported its financial results recently; you can catch up on the latest numbers by reading our company report. It really delights us to see such great share price performance for investors.
Since the stock has added CHF85m to its market cap in the past week alone, let's see if underlying performance has been driving long-term returns.
See our latest analysis for SKAN Group
To paraphrase Benjamin Graham: Over the short term the market is a voting machine, but over the long term it's a weighing machine. One imperfect but simple way to consider how the market perception of a company has shifted is to compare the change in the earnings per share (EPS) with the share price movement.
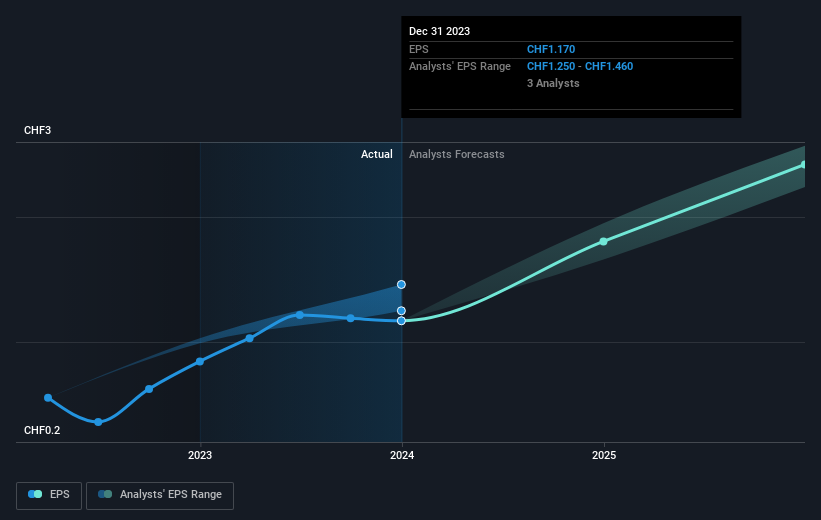
During five years of share price growth, SKAN Group achieved compound earnings per share (EPS) growth of 16% per year. This EPS growth is slower than the share price growth of 57% per year, over the same period. This suggests that market participants hold the company in higher regard, these days. That's not necessarily surprising considering the five-year track record of earnings growth. This favorable sentiment is reflected in its (fairly optimistic) P/E ratio of 72.63.
The graphic below depicts how EPS has changed over time (unveil the exact values by clicking on the image).
It is of course excellent to see how SKAN Group has grown profits over the years, but the future is more important for shareholders. This free interactive report on SKAN Group's balance sheet strength is a great place to start, if you want to investigate the stock further.
What About Dividends?
It is important to consider the total shareholder return, as well as the share price return, for any given stock. The TSR incorporates the value of any spin-offs or discounted capital raisings, along with any dividends, based on the assumption that the dividends are reinvested. It's fair to say that the TSR gives a more complete picture for stocks that pay a dividend. In the case of SKAN Group, it has a TSR of 948% for the last 5 years. That exceeds its share price return that we previously mentioned. The dividends paid by the company have thusly boosted the total shareholder return.
A Different Perspective
We're pleased to report that SKAN Group shareholders have received a total shareholder return of 10% over one year. And that does include the dividend. However, that falls short of the 60% TSR per annum it has made for shareholders, each year, over five years. Potential buyers might understandably feel they've missed the opportunity, but it's always possible business is still firing on all cylinders. While it is well worth considering the different impacts that market conditions can have on the share price, there are other factors that are even more important. Even so, be aware that SKAN Group is showing 1 warning sign in our investment analysis , you should know about...
We will like SKAN Group better if we see some big insider buys. While we wait, check out this free list of growing companies with considerable, recent, insider buying.
Please note, the market returns quoted in this article reflect the market weighted average returns of stocks that currently trade on Swiss exchanges.
Valuation is complex, but we're helping make it simple.
Find out whether SKAN Group is potentially over or undervalued by checking out our comprehensive analysis, which includes fair value estimates, risks and warnings, dividends, insider transactions and financial health.
View the Free AnalysisHave feedback on this article? Concerned about the content? Get in touch with us directly. Alternatively, email editorial-team (at) simplywallst.com.
This article by Simply Wall St is general in nature. We provide commentary based on historical data and analyst forecasts only using an unbiased methodology and our articles are not intended to be financial advice. It does not constitute a recommendation to buy or sell any stock, and does not take account of your objectives, or your financial situation. We aim to bring you long-term focused analysis driven by fundamental data. Note that our analysis may not factor in the latest price-sensitive company announcements or qualitative material. Simply Wall St has no position in any stocks mentioned.
About SWX:SKAN
SKAN Group
SKAN Group AG, together with its subsidiaries, provides isolators, cleanroom devices, and decontamination processes for pharmaceutical and chemical industries in Asia, Europe, the Americas, and internationally.
Excellent balance sheet with reasonable growth potential.

