- Switzerland
- /
- Media
- /
- SWX:MCHN
Even after rising 15% this past week, MCH Group (VTX:MCHN) shareholders are still down 75% over the past five years


MCH Group AG (VTX:MCHN) shareholders should be happy to see the share price up 15% in the last month. But that doesn't change the fact that the returns over the last half decade have been stomach churning. Like a ship taking on water, the share price has sunk 78% in that time. It's true that the recent bounce could signal the company is turning over a new leaf, but we are not so sure. The important question is if the business itself justifies a higher share price in the long term.
On a more encouraging note the company has added CHF17m to its market cap in just the last 7 days, so let's see if we can determine what's driven the five-year loss for shareholders.
See our latest analysis for MCH Group
There is no denying that markets are sometimes efficient, but prices do not always reflect underlying business performance. By comparing earnings per share (EPS) and share price changes over time, we can get a feel for how investor attitudes to a company have morphed over time.
During five years of share price growth, MCH Group moved from a loss to profitability. That would generally be considered a positive, so we are surprised to see the share price is down. Other metrics might give us a better handle on how its value is changing over time.
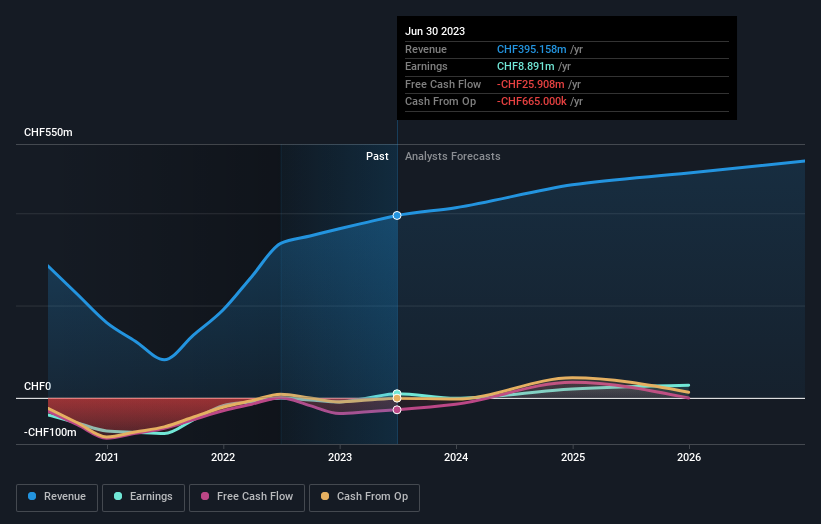
Arguably, the revenue drop of 13% a year for half a decade suggests that the company can't grow in the long term. That could explain the weak share price.
You can see below how earnings and revenue have changed over time (discover the exact values by clicking on the image).
It is of course excellent to see how MCH Group has grown profits over the years, but the future is more important for shareholders. This free interactive report on MCH Group's balance sheet strength is a great place to start, if you want to investigate the stock further.
What About The Total Shareholder Return (TSR)?
Investors should note that there's a difference between MCH Group's total shareholder return (TSR) and its share price change, which we've covered above. The TSR attempts to capture the value of dividends (as if they were reinvested) as well as any spin-offs or discounted capital raisings offered to shareholders. MCH Group's TSR of was a loss of 75% for the 5 years. That wasn't as bad as its share price return, because it has paid dividends.
A Different Perspective
MCH Group shareholders are down 10% for the year, but the market itself is up 3.0%. However, keep in mind that even the best stocks will sometimes underperform the market over a twelve month period. However, the loss over the last year isn't as bad as the 12% per annum loss investors have suffered over the last half decade. We'd need to see some sustained improvements in the key metrics before we could muster much enthusiasm. It's always interesting to track share price performance over the longer term. But to understand MCH Group better, we need to consider many other factors. Even so, be aware that MCH Group is showing 2 warning signs in our investment analysis , and 1 of those is a bit unpleasant...
If you would prefer to check out another company -- one with potentially superior financials -- then do not miss this free list of companies that have proven they can grow earnings.
Please note, the market returns quoted in this article reflect the market weighted average returns of stocks that currently trade on Swiss exchanges.
New: Manage All Your Stock Portfolios in One Place
We've created the ultimate portfolio companion for stock investors, and it's free.
• Connect an unlimited number of Portfolios and see your total in one currency
• Be alerted to new Warning Signs or Risks via email or mobile
• Track the Fair Value of your stocks
Have feedback on this article? Concerned about the content? Get in touch with us directly. Alternatively, email editorial-team (at) simplywallst.com.
This article by Simply Wall St is general in nature. We provide commentary based on historical data and analyst forecasts only using an unbiased methodology and our articles are not intended to be financial advice. It does not constitute a recommendation to buy or sell any stock, and does not take account of your objectives, or your financial situation. We aim to bring you long-term focused analysis driven by fundamental data. Note that our analysis may not factor in the latest price-sensitive company announcements or qualitative material. Simply Wall St has no position in any stocks mentioned.
About SWX:MCHN
MCH Group
Operates as a live marketing company that provides a network of services in the exhibition and event market worldwide.
Undervalued with excellent balance sheet.

