Stock Analysis
- Canada
- /
- Electric Utilities
- /
- TSX:FTS
Investors in Fortis (TSE:FTS) have unfortunately lost 9.3% over the last year

It's easy to match the overall market return by buying an index fund. But if you buy individual stocks, you can do both better or worse than that. For example, the Fortis Inc. (TSE:FTS) share price is down 13% in the last year. That's well below the market return of 7.6%. At least the damage isn't so bad if you look at the last three years, since the stock is down 6.4% in that time.
With that in mind, it's worth seeing if the company's underlying fundamentals have been the driver of long term performance, or if there are some discrepancies.
Check out our latest analysis for Fortis
In his essay The Superinvestors of Graham-and-Doddsville Warren Buffett described how share prices do not always rationally reflect the value of a business. By comparing earnings per share (EPS) and share price changes over time, we can get a feel for how investor attitudes to a company have morphed over time.
Even though the Fortis share price is down over the year, its EPS actually improved. Of course, the situation might betray previous over-optimism about growth.
The divergence between the EPS and the share price is quite notable, during the year. So it's well worth checking out some other metrics, too.
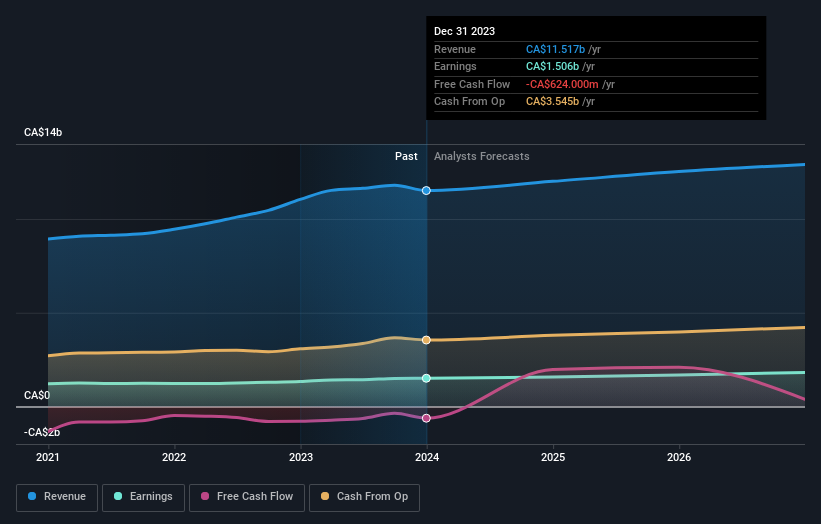
Fortis' dividend seems healthy to us, so we doubt that the yield is a concern for the market. From what we can see, revenue is pretty flat, so that doesn't really explain the share price drop. Of course, it could simply be that it simply fell short of the market consensus expectations.
The company's revenue and earnings (over time) are depicted in the image below (click to see the exact numbers).
It's good to see that there was some significant insider buying in the last three months. That's a positive. That said, we think earnings and revenue growth trends are even more important factors to consider. So we recommend checking out this free report showing consensus forecasts
What About Dividends?
As well as measuring the share price return, investors should also consider the total shareholder return (TSR). Whereas the share price return only reflects the change in the share price, the TSR includes the value of dividends (assuming they were reinvested) and the benefit of any discounted capital raising or spin-off. It's fair to say that the TSR gives a more complete picture for stocks that pay a dividend. As it happens, Fortis' TSR for the last 1 year was -9.3%, which exceeds the share price return mentioned earlier. This is largely a result of its dividend payments!
A Different Perspective
Fortis shareholders are down 9.3% for the year (even including dividends), but the market itself is up 7.6%. Even the share prices of good stocks drop sometimes, but we want to see improvements in the fundamental metrics of a business, before getting too interested. On the bright side, long term shareholders have made money, with a gain of 5% per year over half a decade. If the fundamental data continues to indicate long term sustainable growth, the current sell-off could be an opportunity worth considering. While it is well worth considering the different impacts that market conditions can have on the share price, there are other factors that are even more important. Case in point: We've spotted 2 warning signs for Fortis you should be aware of, and 1 of them is concerning.
There are plenty of other companies that have insiders buying up shares. You probably do not want to miss this free list of growing companies that insiders are buying.
Please note, the market returns quoted in this article reflect the market weighted average returns of stocks that currently trade on Canadian exchanges.
Valuation is complex, but we're helping make it simple.
Find out whether Fortis is potentially over or undervalued by checking out our comprehensive analysis, which includes fair value estimates, risks and warnings, dividends, insider transactions and financial health.
View the Free AnalysisHave feedback on this article? Concerned about the content? Get in touch with us directly. Alternatively, email editorial-team (at) simplywallst.com.
This article by Simply Wall St is general in nature. We provide commentary based on historical data and analyst forecasts only using an unbiased methodology and our articles are not intended to be financial advice. It does not constitute a recommendation to buy or sell any stock, and does not take account of your objectives, or your financial situation. We aim to bring you long-term focused analysis driven by fundamental data. Note that our analysis may not factor in the latest price-sensitive company announcements or qualitative material. Simply Wall St has no position in any stocks mentioned.

Simply Wall St
About TSX:FTS
Fortis
Fortis Inc. operates as an electric and gas utility company in Canada, the United States, and the Caribbean countries.
Solid track record, good value and pays a dividend.
