- Canada
- /
- Real Estate
- /
- TSX:MPC
Madison Pacific Properties (TSE:MPC) surges 12% this week, taking five-year gains to 96%


Generally speaking the aim of active stock picking is to find companies that provide returns that are superior to the market average. And while active stock picking involves risks (and requires diversification) it can also provide excess returns. For example, long term Madison Pacific Properties Inc. (TSE:MPC) shareholders have enjoyed a 64% share price rise over the last half decade, well in excess of the market return of around 46% (not including dividends). However, more recent returns haven't been as impressive as that, with the stock returning just 2.3% in the last year, including dividends.
The past week has proven to be lucrative for Madison Pacific Properties investors, so let's see if fundamentals drove the company's five-year performance.
View our latest analysis for Madison Pacific Properties
In his essay The Superinvestors of Graham-and-Doddsville Warren Buffett described how share prices do not always rationally reflect the value of a business. One way to examine how market sentiment has changed over time is to look at the interaction between a company's share price and its earnings per share (EPS).
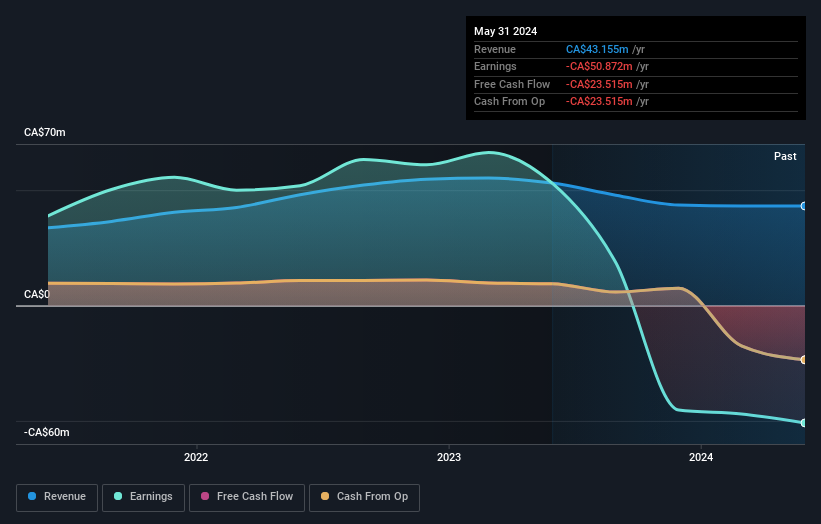
During five years of share price growth, Madison Pacific Properties actually saw its EPS drop 22% per year.
This means it's unlikely the market is judging the company based on earnings growth. Since the change in EPS doesn't seem to correlate with the change in share price, it's worth taking a look at other metrics.
The modest 1.8% dividend yield is unlikely to be propping up the share price. In contrast revenue growth of 10% per year is probably viewed as evidence that Madison Pacific Properties is growing, a real positive. In that case, the company may be sacrificing current earnings per share to drive growth.
The image below shows how earnings and revenue have tracked over time (if you click on the image you can see greater detail).
It's probably worth noting that the CEO is paid less than the median at similar sized companies. It's always worth keeping an eye on CEO pay, but a more important question is whether the company will grow earnings throughout the years. Before buying or selling a stock, we always recommend a close examination of historic growth trends, available here..
What About Dividends?
As well as measuring the share price return, investors should also consider the total shareholder return (TSR). The TSR is a return calculation that accounts for the value of cash dividends (assuming that any dividend received was reinvested) and the calculated value of any discounted capital raisings and spin-offs. It's fair to say that the TSR gives a more complete picture for stocks that pay a dividend. As it happens, Madison Pacific Properties' TSR for the last 5 years was 96%, which exceeds the share price return mentioned earlier. And there's no prize for guessing that the dividend payments largely explain the divergence!
A Different Perspective
Madison Pacific Properties shareholders are up 2.3% for the year (even including dividends). But that was short of the market average. On the bright side, the longer term returns (running at about 14% a year, over half a decade) look better. It may well be that this is a business worth popping on the watching, given the continuing positive reception, over time, from the market. I find it very interesting to look at share price over the long term as a proxy for business performance. But to truly gain insight, we need to consider other information, too. Consider risks, for instance. Every company has them, and we've spotted 4 warning signs for Madison Pacific Properties you should know about.
But note: Madison Pacific Properties may not be the best stock to buy. So take a peek at this free list of interesting companies with past earnings growth (and further growth forecast).
Please note, the market returns quoted in this article reflect the market weighted average returns of stocks that currently trade on Canadian exchanges.
New: Manage All Your Stock Portfolios in One Place
We've created the ultimate portfolio companion for stock investors, and it's free.
• Connect an unlimited number of Portfolios and see your total in one currency
• Be alerted to new Warning Signs or Risks via email or mobile
• Track the Fair Value of your stocks
Have feedback on this article? Concerned about the content? Get in touch with us directly. Alternatively, email editorial-team (at) simplywallst.com.
This article by Simply Wall St is general in nature. We provide commentary based on historical data and analyst forecasts only using an unbiased methodology and our articles are not intended to be financial advice. It does not constitute a recommendation to buy or sell any stock, and does not take account of your objectives, or your financial situation. We aim to bring you long-term focused analysis driven by fundamental data. Note that our analysis may not factor in the latest price-sensitive company announcements or qualitative material. Simply Wall St has no position in any stocks mentioned.
About TSX:MPC
Madison Pacific Properties
Engages in owning, developing, and managing real estate properties in Canada.
Slight unattractive dividend payer.

