
Advertisement
- Canada
- /
- Interactive Media and Services
- /
- TSX:ILLM
Some illumin Holdings Inc. (TSE:ILLM) Shareholders Look For Exit As Shares Take 26% Pounding
Unfortunately for some shareholders, the illumin Holdings Inc. (TSE:ILLM) share price has dived 26% in the last thirty days, prolonging recent pain. Instead of being rewarded, shareholders who have already held through the last twelve months are now sitting on a 47% share price drop.
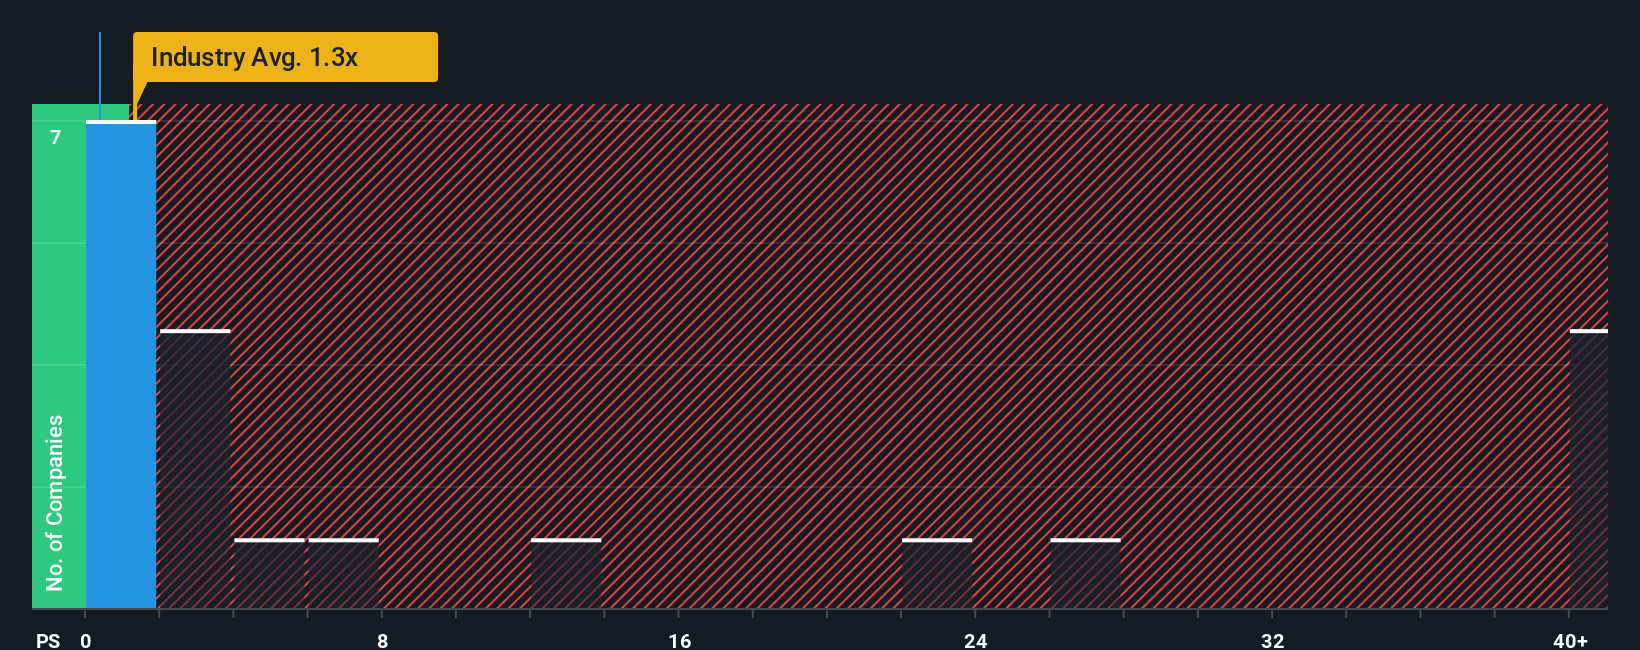
In spite of the heavy fall in price, you could still be forgiven for feeling indifferent about illumin Holdings' P/S ratio of 0.3x, since the median price-to-sales (or "P/S") ratio for the Interactive Media and Services industry in Canada is also close to 0.8x. Although, it's not wise to simply ignore the P/S without explanation as investors may be disregarding a distinct opportunity or a costly mistake.
Check out our latest analysis for illumin Holdings
What Does illumin Holdings' Recent Performance Look Like?
illumin Holdings has been doing a good job lately as it's been growing revenue at a solid pace. It might be that many expect the respectable revenue performance to wane, which has kept the P/S from rising. If you like the company, you'd be hoping this isn't the case so that you could potentially pick up some stock while it's not quite in favour.
We don't have analyst forecasts, but you can see how recent trends are setting up the company for the future by checking out our free report on illumin Holdings' earnings, revenue and cash flow.How Is illumin Holdings' Revenue Growth Trending?
There's an inherent assumption that a company should be matching the industry for P/S ratios like illumin Holdings' to be considered reasonable.
If we review the last year of revenue growth, the company posted a terrific increase of 23%. The latest three year period has also seen a 26% overall rise in revenue, aided extensively by its short-term performance. Therefore, it's fair to say the revenue growth recently has been respectable for the company.
This is in contrast to the rest of the industry, which is expected to grow by 16% over the next year, materially higher than the company's recent medium-term annualised growth rates.
With this in mind, we find it intriguing that illumin Holdings' P/S is comparable to that of its industry peers. It seems most investors are ignoring the fairly limited recent growth rates and are willing to pay up for exposure to the stock. Maintaining these prices will be difficult to achieve as a continuation of recent revenue trends is likely to weigh down the shares eventually.
The Key Takeaway
With its share price dropping off a cliff, the P/S for illumin Holdings looks to be in line with the rest of the Interactive Media and Services industry. We'd say the price-to-sales ratio's power isn't primarily as a valuation instrument but rather to gauge current investor sentiment and future expectations.
Our examination of illumin Holdings revealed its poor three-year revenue trends aren't resulting in a lower P/S as per our expectations, given they look worse than current industry outlook. Right now we are uncomfortable with the P/S as this revenue performance isn't likely to support a more positive sentiment for long. Unless there is a significant improvement in the company's medium-term performance, it will be difficult to prevent the P/S ratio from declining to a more reasonable level.
You should always think about risks. Case in point, we've spotted 3 warning signs for illumin Holdings you should be aware of, and 1 of them makes us a bit uncomfortable.
If companies with solid past earnings growth is up your alley, you may wish to see this free collection of other companies with strong earnings growth and low P/E ratios.
Valuation is complex, but we're here to simplify it.
Discover if illumin Holdings might be undervalued or overvalued with our detailed analysis, featuring fair value estimates, potential risks, dividends, insider trades, and its financial condition.
Access Free AnalysisHave feedback on this article? Concerned about the content? Get in touch with us directly. Alternatively, email editorial-team (at) simplywallst.com.
This article by Simply Wall St is general in nature. We provide commentary based on historical data and analyst forecasts only using an unbiased methodology and our articles are not intended to be financial advice. It does not constitute a recommendation to buy or sell any stock, and does not take account of your objectives, or your financial situation. We aim to bring you long-term focused analysis driven by fundamental data. Note that our analysis may not factor in the latest price-sensitive company announcements or qualitative material. Simply Wall St has no position in any stocks mentioned.
About TSX:ILLM
illumin Holdings
A technology company, provides digital media solutions in the United States, Canada, Europe, Latin America, and internationally.
Excellent balance sheet and fair value.
Similar Companies
Market Insights

Advertisement
Community Narratives
The company that turned a verb into a global necessity and basically runs the modern internet, digital ads, smartphones, maps, and AI.
Fair Value US$300.00|7.1% undervalued
OS
Community Contributor
Flowers Foods Pays A Fair Price For Health
Fair Value US$16.12|26.4% undervalued
NV
Community Contributor
TMX Group will thrive with 33.3% profit margin and enduring market moat
Fair Value CA$49.90|0.8% overvalued
LI
Community Contributor
The "Molecular Pencil": Why Beam's Technology is Built to Win
Fair Value US$65.01|65.8% undervalued
DA
Community Contributor