Advertisement
- Canada
- /
- Metals and Mining
- /
- TSX:TMQ
3 TSX Penny Stocks With Market Caps Under CA$500M

Simply Wall St
Reviewed by Simply Wall St
Despite rising tariff rates, the Canadian market has shown resilience with inflation and economic data remaining stable. This stability provides a backdrop for exploring investment opportunities in lesser-known areas of the market, such as penny stocks. Although the term "penny stock" might seem outdated, these smaller or newer companies can offer significant growth potential when they possess strong financials and sound fundamentals.
Top 10 Penny Stocks In Canada
| Name | Share Price | Market Cap | Rewards & Risks |
| Westbridge Renewable Energy (TSXV:WEB) | CA$0.67 | CA$70.8M | ✅ 3 ⚠️ 3 View Analysis > |
| illumin Holdings (TSX:ILLM) | CA$2.11 | CA$107.87M | ✅ 4 ⚠️ 1 View Analysis > |
| Fintech Select (TSXV:FTEC) | CA$0.025 | CA$2M | ✅ 2 ⚠️ 3 View Analysis > |
| Foraco International (TSX:FAR) | CA$1.80 | CA$176.55M | ✅ 4 ⚠️ 1 View Analysis > |
| Findev (TSXV:FDI) | CA$0.425 | CA$12.18M | ✅ 2 ⚠️ 4 View Analysis > |
| Thor Explorations (TSXV:THX) | CA$0.78 | CA$505.63M | ✅ 3 ⚠️ 2 View Analysis > |
| Pulse Seismic (TSX:PSD) | CA$3.43 | CA$171.55M | ✅ 1 ⚠️ 1 View Analysis > |
| ACT Energy Technologies (TSX:ACX) | CA$4.69 | CA$153.38M | ✅ 3 ⚠️ 2 View Analysis > |
| Hemisphere Energy (TSXV:HME) | CA$1.94 | CA$185.15M | ✅ 3 ⚠️ 1 View Analysis > |
| McChip Resources (TSXV:MCS) | CA$1.80 | CA$10.51M | ✅ 2 ⚠️ 4 View Analysis > |
Click here to see the full list of 449 stocks from our TSX Penny Stocks screener.
Below we spotlight a couple of our favorites from our exclusive screener.
Mandalay Resources (TSX:MND)
Simply Wall St Financial Health Rating: ★★★★★★
Overview: Mandalay Resources Corporation operates in the acquisition, exploration, extraction, processing, and reclamation of mineral properties across Australia, Sweden, Chile, and Canada with a market cap of CA$439.80 million.
Operations: The company generates revenue from its Metals & Mining segment, specifically focusing on Gold & Other Precious Metals, amounting to $263.21 million.
Market Cap: CA$439.8M
Mandalay Resources has demonstrated significant growth potential, with earnings increasing by 329.7% over the past year and a high net profit margin of 21.5%. The company's financial health is robust, evidenced by its debt being well-covered by operating cash flow and interest payments comfortably managed. Recent exploration updates at the True Blue discovery in Australia and Bjorkdal mine in Sweden highlight promising resource expansion opportunities, potentially enhancing future production capabilities. Additionally, an upcoming merger with Alkane Resources aims to strengthen operational continuity across key mining sites, subject to shareholder approval expected in Q3 2025.
- Click here and access our complete financial health analysis report to understand the dynamics of Mandalay Resources.
- Examine Mandalay Resources' earnings growth report to understand how analysts expect it to perform.

Quipt Home Medical (TSX:QIPT)
Simply Wall St Financial Health Rating: ★★★★☆☆
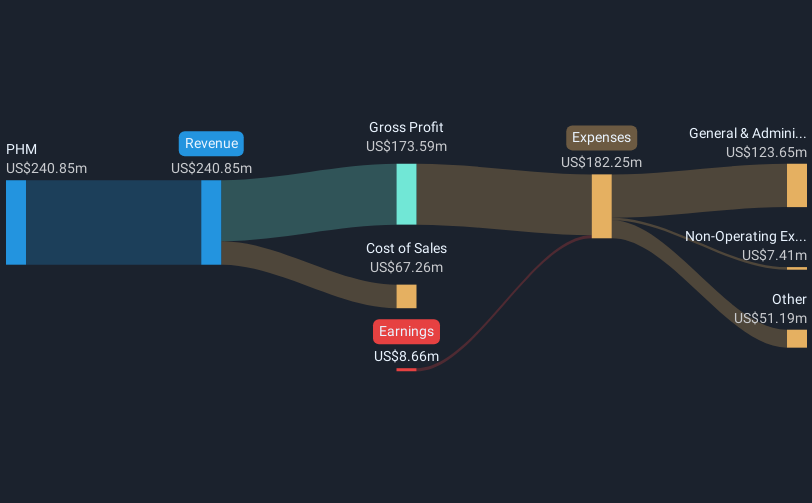
Overview: Quipt Home Medical Corp., operating through its subsidiaries, provides durable and home medical equipment and supplies across the United States, with a market cap of CA$119.91 million.
Operations: The company generates $240.85 million in revenue from providing durable and home medical equipment and supplies throughout the United States.
Market Cap: CA$119.91M
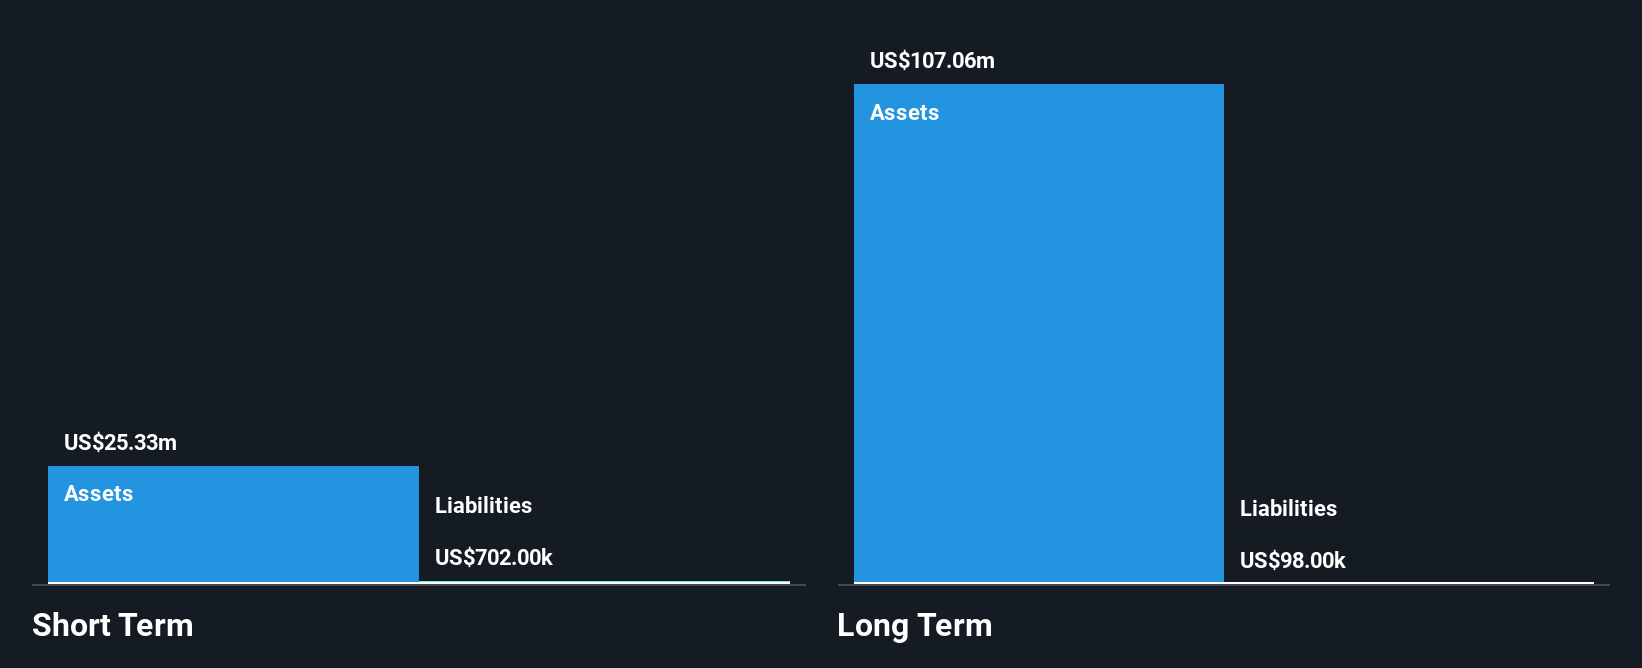
Quipt Home Medical, with a market cap of CA$119.91 million, is trading significantly below its estimated fair value but remains unprofitable with a negative return on equity and high debt levels. Despite generating US$240.85 million in revenue, it faces challenges such as increased losses over the past five years and forecasted earnings decline. Recently, Quipt was dropped from numerous Russell indices and received an unsolicited acquisition offer from Forager Capital Management at a premium price of $3.10 per share, highlighting potential investor interest despite its volatile share price and ongoing financial difficulties.
- Take a closer look at Quipt Home Medical's potential here in our financial health report.
- Gain insights into Quipt Home Medical's future direction by reviewing our growth report.
Trilogy Metals (TSX:TMQ)
Simply Wall St Financial Health Rating: ★★★★★★
Overview: Trilogy Metals Inc. focuses on the exploration and development of mineral properties in the United States, with a market cap of CA$417.17 million.
Operations: Trilogy Metals Inc. has not reported any specific revenue segments.
Market Cap: CA$417.17M
Trilogy Metals Inc., with a market cap of CA$417.17 million, is pre-revenue and unprofitable, reporting a net loss of US$2.18 million for the recent quarter. Despite this, the company maintains financial stability with no debt and short-term assets exceeding liabilities significantly. The management team is experienced with an average tenure of 5.1 years, while its board averages 10.1 years in tenure. Trilogy recently filed a follow-on equity offering worth $25 million to bolster its cash reserves further, which currently provide more than three years of runway if free cash flow continues growing at historical rates.
- Unlock comprehensive insights into our analysis of Trilogy Metals stock in this financial health report.
- Explore historical data to track Trilogy Metals' performance over time in our past results report.
Next Steps
- Investigate our full lineup of 449 TSX Penny Stocks right here.
- Contemplating Other Strategies? AI is about to change healthcare. These 26 stocks are working on everything from early diagnostics to drug discovery. The best part - they are all under $10b in market cap - there's still time to get in early.
This article by Simply Wall St is general in nature. We provide commentary based on historical data and analyst forecasts only using an unbiased methodology and our articles are not intended to be financial advice. It does not constitute a recommendation to buy or sell any stock, and does not take account of your objectives, or your financial situation. We aim to bring you long-term focused analysis driven by fundamental data. Note that our analysis may not factor in the latest price-sensitive company announcements or qualitative material. Simply Wall St has no position in any stocks mentioned.
Valuation is complex, but we're here to simplify it.
Discover if Trilogy Metals might be undervalued or overvalued with our detailed analysis, featuring fair value estimates, potential risks, dividends, insider trades, and its financial condition.
Access Free AnalysisHave feedback on this article? Concerned about the content? Get in touch with us directly. Alternatively, email editorial-team@simplywallst.com
About TSX:TMQ
Trilogy Metals
Engages in the exploration and development of mineral properties in the United States.
Flawless balance sheet with moderate risk.
Similar Companies
Market Insights

Advertisement
Community Narratives
The company that turned a verb into a global necessity and basically runs the modern internet, digital ads, smartphones, maps, and AI.
Fair Value US$300.00|7.1% undervalued
OS
Community Contributor
Flowers Foods Pays A Fair Price For Health
Fair Value US$16.12|26.4% undervalued
NV
Community Contributor
TMX Group will thrive with 33.3% profit margin and enduring market moat
Fair Value CA$49.90|0.8% overvalued
LI
Community Contributor
The "Molecular Pencil": Why Beam's Technology is Built to Win
Fair Value US$65.01|65.8% undervalued
DA
Community Contributor