
Advertisement
- Canada
- /
- Metals and Mining
- /
- TSX:TECK.B
Calculating The Intrinsic Value Of Teck Resources Limited (TSE:TECK.B)
Key Insights
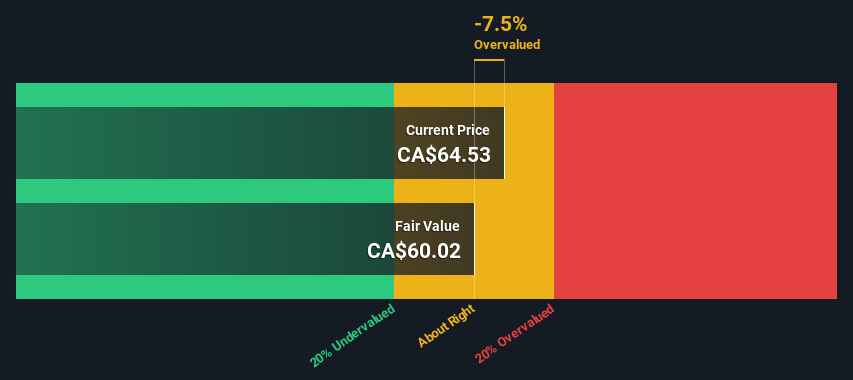
- Teck Resources' estimated fair value is CA$60.02 based on 2 Stage Free Cash Flow to Equity
- Current share price of CA$64.53 suggests Teck Resources is potentially trading close to its fair value
- Our fair value estimate is 18% lower than Teck Resources' analyst price target of CA$73.62
Today we'll do a simple run through of a valuation method used to estimate the attractiveness of Teck Resources Limited (TSE:TECK.B) as an investment opportunity by taking the expected future cash flows and discounting them to today's value. One way to achieve this is by employing the Discounted Cash Flow (DCF) model. Models like these may appear beyond the comprehension of a lay person, but they're fairly easy to follow.
We generally believe that a company's value is the present value of all of the cash it will generate in the future. However, a DCF is just one valuation metric among many, and it is not without flaws. If you still have some burning questions about this type of valuation, take a look at the Simply Wall St analysis model.
See our latest analysis for Teck Resources
The Calculation
We're using the 2-stage growth model, which simply means we take in account two stages of company's growth. In the initial period the company may have a higher growth rate and the second stage is usually assumed to have a stable growth rate. To start off with, we need to estimate the next ten years of cash flows. Where possible we use analyst estimates, but when these aren't available we extrapolate the previous free cash flow (FCF) from the last estimate or reported value. We assume companies with shrinking free cash flow will slow their rate of shrinkage, and that companies with growing free cash flow will see their growth rate slow, over this period. We do this to reflect that growth tends to slow more in the early years than it does in later years.
A DCF is all about the idea that a dollar in the future is less valuable than a dollar today, so we need to discount the sum of these future cash flows to arrive at a present value estimate:
10-year free cash flow (FCF) forecast
| 2025 | 2026 | 2027 | 2028 | 2029 | 2030 | 2031 | 2032 | 2033 | 2034 | |
| Levered FCF (CA$, Millions) | CA$1.56b | CA$2.03b | CA$2.35b | CA$2.11b | CA$1.97b | CA$1.90b | CA$1.86b | CA$1.85b | CA$1.85b | CA$1.86b |
| Growth Rate Estimate Source | Analyst x6 | Analyst x4 | Analyst x2 | Analyst x2 | Est @ -6.32% | Est @ -3.77% | Est @ -1.98% | Est @ -0.73% | Est @ 0.14% | Est @ 0.75% |
| Present Value (CA$, Millions) Discounted @ 7.4% | CA$1.5k | CA$1.8k | CA$1.9k | CA$1.6k | CA$1.4k | CA$1.2k | CA$1.1k | CA$1.0k | CA$972 | CA$912 |
("Est" = FCF growth rate estimated by Simply Wall St)
Present Value of 10-year Cash Flow (PVCF) = CA$13b
The second stage is also known as Terminal Value, this is the business's cash flow after the first stage. For a number of reasons a very conservative growth rate is used that cannot exceed that of a country's GDP growth. In this case we have used the 5-year average of the 10-year government bond yield (2.2%) to estimate future growth. In the same way as with the 10-year 'growth' period, we discount future cash flows to today's value, using a cost of equity of 7.4%.
Terminal Value (TV)= FCF2034 × (1 + g) ÷ (r – g) = CA$1.9b× (1 + 2.2%) ÷ (7.4%– 2.2%) = CA$36b
Present Value of Terminal Value (PVTV)= TV / (1 + r)10= CA$36b÷ ( 1 + 7.4%)10= CA$18b
The total value, or equity value, is then the sum of the present value of the future cash flows, which in this case is CA$31b. In the final step we divide the equity value by the number of shares outstanding. Relative to the current share price of CA$64.5, the company appears around fair value at the time of writing. Remember though, that this is just an approximate valuation, and like any complex formula - garbage in, garbage out.
Important Assumptions
We would point out that the most important inputs to a discounted cash flow are the discount rate and of course the actual cash flows. Part of investing is coming up with your own evaluation of a company's future performance, so try the calculation yourself and check your own assumptions. The DCF also does not consider the possible cyclicality of an industry, or a company's future capital requirements, so it does not give a full picture of a company's potential performance. Given that we are looking at Teck Resources as potential shareholders, the cost of equity is used as the discount rate, rather than the cost of capital (or weighted average cost of capital, WACC) which accounts for debt. In this calculation we've used 7.4%, which is based on a levered beta of 1.269. Beta is a measure of a stock's volatility, compared to the market as a whole. We get our beta from the industry average beta of globally comparable companies, with an imposed limit between 0.8 and 2.0, which is a reasonable range for a stable business.
SWOT Analysis for Teck Resources
Strength
- Debt is not viewed as a risk.
Weakness
- Earnings declined over the past year.
- Dividend is low compared to the top 25% of dividend payers in the Metals and Mining market.
- Expensive based on P/E ratio and estimated fair value.
Opportunity
- Significant insider buying over the past 3 months.
Threat
- Annual earnings are forecast to decline for the next 3 years.
Moving On:
Whilst important, the DCF calculation ideally won't be the sole piece of analysis you scrutinize for a company. It's not possible to obtain a foolproof valuation with a DCF model. Rather it should be seen as a guide to "what assumptions need to be true for this stock to be under/overvalued?" For instance, if the terminal value growth rate is adjusted slightly, it can dramatically alter the overall result. For Teck Resources, we've put together three pertinent aspects you should explore:
- Risks: Take risks, for example - Teck Resources has 3 warning signs (and 1 which doesn't sit too well with us) we think you should know about.
- Management:Have insiders been ramping up their shares to take advantage of the market's sentiment for TECK.B's future outlook? Check out our management and board analysis with insights on CEO compensation and governance factors.
- Other High Quality Alternatives: Do you like a good all-rounder? Explore our interactive list of high quality stocks to get an idea of what else is out there you may be missing!
PS. Simply Wall St updates its DCF calculation for every Canadian stock every day, so if you want to find the intrinsic value of any other stock just search here.
Valuation is complex, but we're here to simplify it.
Discover if Teck Resources might be undervalued or overvalued with our detailed analysis, featuring fair value estimates, potential risks, dividends, insider trades, and its financial condition.
Access Free AnalysisHave feedback on this article? Concerned about the content? Get in touch with us directly. Alternatively, email editorial-team (at) simplywallst.com.
This article by Simply Wall St is general in nature. We provide commentary based on historical data and analyst forecasts only using an unbiased methodology and our articles are not intended to be financial advice. It does not constitute a recommendation to buy or sell any stock, and does not take account of your objectives, or your financial situation. We aim to bring you long-term focused analysis driven by fundamental data. Note that our analysis may not factor in the latest price-sensitive company announcements or qualitative material. Simply Wall St has no position in any stocks mentioned.
About TSX:TECK.B
Teck Resources
Engages in research, exploration, development, processing, smelting, refining, and reclamation of mineral properties in Asia, the Americas, and Europe.
Fair value with acceptable track record.
Similar Companies
Market Insights

Advertisement
Community Narratives
The company that turned a verb into a global necessity and basically runs the modern internet, digital ads, smartphones, maps, and AI.
Fair Value US$300.00|7.1% undervalued
OS
Community Contributor
Flowers Foods Pays A Fair Price For Health
Fair Value US$16.12|26.4% undervalued
NV
Community Contributor
TMX Group will thrive with 33.3% profit margin and enduring market moat
Fair Value CA$49.90|0.8% overvalued
LI
Community Contributor
The "Molecular Pencil": Why Beam's Technology is Built to Win
Fair Value US$65.01|65.8% undervalued
DA
Community Contributor