Stock Analysis
- Canada
- /
- Metals and Mining
- /
- TSX:GMIN
G Mining Ventures Corp.'s (TSE:GMIN) Intrinsic Value Is Potentially 45% Above Its Share Price
Key Insights
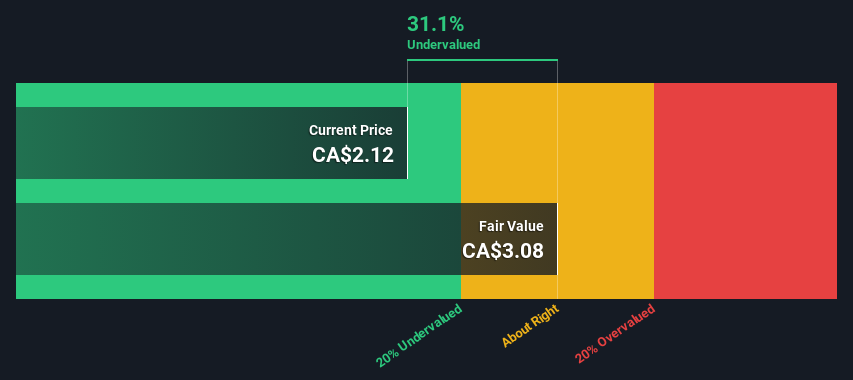
- Using the 2 Stage Free Cash Flow to Equity, G Mining Ventures fair value estimate is CA$3.08
- G Mining Ventures is estimated to be 31% undervalued based on current share price of CA$2.12
- Analyst price target for GMIN is US$2.44 which is 21% below our fair value estimate
How far off is G Mining Ventures Corp. (TSE:GMIN) from its intrinsic value? Using the most recent financial data, we'll take a look at whether the stock is fairly priced by taking the expected future cash flows and discounting them to today's value. One way to achieve this is by employing the Discounted Cash Flow (DCF) model. Don't get put off by the jargon, the math behind it is actually quite straightforward.
Companies can be valued in a lot of ways, so we would point out that a DCF is not perfect for every situation. For those who are keen learners of equity analysis, the Simply Wall St analysis model here may be something of interest to you.
Check out our latest analysis for G Mining Ventures
Crunching The Numbers
We're using the 2-stage growth model, which simply means we take in account two stages of company's growth. In the initial period the company may have a higher growth rate and the second stage is usually assumed to have a stable growth rate. To begin with, we have to get estimates of the next ten years of cash flows. Where possible we use analyst estimates, but when these aren't available we extrapolate the previous free cash flow (FCF) from the last estimate or reported value. We assume companies with shrinking free cash flow will slow their rate of shrinkage, and that companies with growing free cash flow will see their growth rate slow, over this period. We do this to reflect that growth tends to slow more in the early years than it does in later years.
A DCF is all about the idea that a dollar in the future is less valuable than a dollar today, so we need to discount the sum of these future cash flows to arrive at a present value estimate:
10-year free cash flow (FCF) estimate
| 2024 | 2025 | 2026 | 2027 | 2028 | 2029 | 2030 | 2031 | 2032 | 2033 | |
| Levered FCF ($, Millions) | -US$90.6m | US$144.0m | US$105.0m | US$84.5m | US$73.4m | US$67.1m | US$63.4m | US$61.4m | US$60.4m | US$60.1m |
| Growth Rate Estimate Source | Analyst x2 | Analyst x1 | Analyst x1 | Est @ -19.59% | Est @ -13.11% | Est @ -8.58% | Est @ -5.41% | Est @ -3.19% | Est @ -1.64% | Est @ -0.55% |
| Present Value ($, Millions) Discounted @ 7.2% | -US$84.6 | US$125 | US$85.4 | US$64.1 | US$51.9 | US$44.3 | US$39.1 | US$35.3 | US$32.4 | US$30.1 |
("Est" = FCF growth rate estimated by Simply Wall St)
Present Value of 10-year Cash Flow (PVCF) = US$423m
We now need to calculate the Terminal Value, which accounts for all the future cash flows after this ten year period. The Gordon Growth formula is used to calculate Terminal Value at a future annual growth rate equal to the 5-year average of the 10-year government bond yield of 2.0%. We discount the terminal cash flows to today's value at a cost of equity of 7.2%.
Terminal Value (TV)= FCF2033 × (1 + g) ÷ (r – g) = US$60m× (1 + 2.0%) ÷ (7.2%– 2.0%) = US$1.2b
Present Value of Terminal Value (PVTV)= TV / (1 + r)10= US$1.2b÷ ( 1 + 7.2%)10= US$594m
The total value, or equity value, is then the sum of the present value of the future cash flows, which in this case is US$1.0b. To get the intrinsic value per share, we divide this by the total number of shares outstanding. Compared to the current share price of CA$2.1, the company appears quite good value at a 31% discount to where the stock price trades currently. Valuations are imprecise instruments though, rather like a telescope - move a few degrees and end up in a different galaxy. Do keep this in mind.
The Assumptions
The calculation above is very dependent on two assumptions. The first is the discount rate and the other is the cash flows. Part of investing is coming up with your own evaluation of a company's future performance, so try the calculation yourself and check your own assumptions. The DCF also does not consider the possible cyclicality of an industry, or a company's future capital requirements, so it does not give a full picture of a company's potential performance. Given that we are looking at G Mining Ventures as potential shareholders, the cost of equity is used as the discount rate, rather than the cost of capital (or weighted average cost of capital, WACC) which accounts for debt. In this calculation we've used 7.2%, which is based on a levered beta of 1.123. Beta is a measure of a stock's volatility, compared to the market as a whole. We get our beta from the industry average beta of globally comparable companies, with an imposed limit between 0.8 and 2.0, which is a reasonable range for a stable business.
SWOT Analysis for G Mining Ventures
- Debt is not viewed as a risk.
- No major weaknesses identified for GMIN.
- Forecast to reduce losses next year.
- Trading below our estimate of fair value by more than 20%.
- Has less than 3 years of cash runway based on current free cash flow.
- Not expected to become profitable over the next 3 years.
Next Steps:
Whilst important, the DCF calculation ideally won't be the sole piece of analysis you scrutinize for a company. It's not possible to obtain a foolproof valuation with a DCF model. Instead the best use for a DCF model is to test certain assumptions and theories to see if they would lead to the company being undervalued or overvalued. For example, changes in the company's cost of equity or the risk free rate can significantly impact the valuation. What is the reason for the share price sitting below the intrinsic value? For G Mining Ventures, there are three relevant items you should assess:
- Risks: To that end, you should learn about the 2 warning signs we've spotted with G Mining Ventures (including 1 which is concerning) .
- Future Earnings: How does GMIN's growth rate compare to its peers and the wider market? Dig deeper into the analyst consensus number for the upcoming years by interacting with our free analyst growth expectation chart.
- Other High Quality Alternatives: Do you like a good all-rounder? Explore our interactive list of high quality stocks to get an idea of what else is out there you may be missing!
PS. The Simply Wall St app conducts a discounted cash flow valuation for every stock on the TSX every day. If you want to find the calculation for other stocks just search here.
Valuation is complex, but we're helping make it simple.
Find out whether G Mining Ventures is potentially over or undervalued by checking out our comprehensive analysis, which includes fair value estimates, risks and warnings, dividends, insider transactions and financial health.
View the Free AnalysisHave feedback on this article? Concerned about the content? Get in touch with us directly. Alternatively, email editorial-team (at) simplywallst.com.
This article by Simply Wall St is general in nature. We provide commentary based on historical data and analyst forecasts only using an unbiased methodology and our articles are not intended to be financial advice. It does not constitute a recommendation to buy or sell any stock, and does not take account of your objectives, or your financial situation. We aim to bring you long-term focused analysis driven by fundamental data. Note that our analysis may not factor in the latest price-sensitive company announcements or qualitative material. Simply Wall St has no position in any stocks mentioned.
About TSX:GMIN
G Mining Ventures
G Mining Ventures Corp. engages in the acquisition, exploration, evaluation, and development of mineral properties.
Exceptional growth potential and fair value.

