- Canada
- /
- Metals and Mining
- /
- TSX:DRX
Recent 11% pullback isn't enough to hurt long-term ADF Group (TSE:DRX) shareholders, they're still up 756% over 5 years


ADF Group Inc. (TSE:DRX) shareholders might be concerned after seeing the share price drop 11% in the last week. But that does not change the realty that the stock's performance has been terrific, over five years. To be precise, the stock price is 700% higher than it was five years ago, a wonderful performance by any measure. So we don't think the recent decline in the share price means its story is a sad one. Only time will tell if there is still too much optimism currently reflected in the share price. It really delights us to see such great share price performance for investors.
While the stock has fallen 11% this week, it's worth focusing on the longer term and seeing if the stocks historical returns have been driven by the underlying fundamentals.
Check out our latest analysis for ADF Group
There is no denying that markets are sometimes efficient, but prices do not always reflect underlying business performance. One flawed but reasonable way to assess how sentiment around a company has changed is to compare the earnings per share (EPS) with the share price.
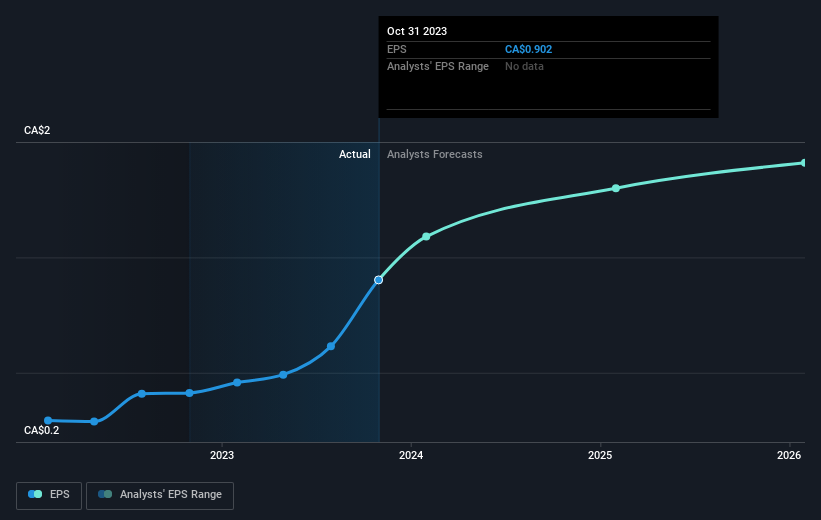
During the five years of share price growth, ADF Group moved from a loss to profitability. Sometimes, the start of profitability is a major inflection point that can signal fast earnings growth to come, which in turn justifies very strong share price gains. Since the company was unprofitable five years ago, but not three years ago, it's worth taking a look at the returns in the last three years, too. We can see that the ADF Group share price is up 441% in the last three years. In the same period, EPS is up 85% per year. That makes the EPS growth rather close to the annualized share price gain of 76% over the same period. So you could reasonably conclude that investor sentiment towards the stock has remained pretty steady, over time. There's a strong correlation between the share price and EPS.
You can see below how EPS has changed over time (discover the exact values by clicking on the image).
It is of course excellent to see how ADF Group has grown profits over the years, but the future is more important for shareholders. It might be well worthwhile taking a look at our free report on how its financial position has changed over time.
What About Dividends?
It is important to consider the total shareholder return, as well as the share price return, for any given stock. Whereas the share price return only reflects the change in the share price, the TSR includes the value of dividends (assuming they were reinvested) and the benefit of any discounted capital raising or spin-off. Arguably, the TSR gives a more comprehensive picture of the return generated by a stock. As it happens, ADF Group's TSR for the last 5 years was 756%, which exceeds the share price return mentioned earlier. This is largely a result of its dividend payments!
A Different Perspective
It's nice to see that ADF Group shareholders have received a total shareholder return of 326% over the last year. And that does include the dividend. That's better than the annualised return of 54% over half a decade, implying that the company is doing better recently. Given the share price momentum remains strong, it might be worth taking a closer look at the stock, lest you miss an opportunity. If you would like to research ADF Group in more detail then you might want to take a look at whether insiders have been buying or selling shares in the company.
Of course ADF Group may not be the best stock to buy. So you may wish to see this free collection of growth stocks.
Please note, the market returns quoted in this article reflect the market weighted average returns of stocks that currently trade on Canadian exchanges.
New: Manage All Your Stock Portfolios in One Place
We've created the ultimate portfolio companion for stock investors, and it's free.
• Connect an unlimited number of Portfolios and see your total in one currency
• Be alerted to new Warning Signs or Risks via email or mobile
• Track the Fair Value of your stocks
Have feedback on this article? Concerned about the content? Get in touch with us directly. Alternatively, email editorial-team (at) simplywallst.com.
This article by Simply Wall St is general in nature. We provide commentary based on historical data and analyst forecasts only using an unbiased methodology and our articles are not intended to be financial advice. It does not constitute a recommendation to buy or sell any stock, and does not take account of your objectives, or your financial situation. We aim to bring you long-term focused analysis driven by fundamental data. Note that our analysis may not factor in the latest price-sensitive company announcements or qualitative material. Simply Wall St has no position in any stocks mentioned.
About TSX:DRX
ADF Group
Engages in the design and engineering of connections including industrial coatings in Canada and the United States.
Outstanding track record with flawless balance sheet.
