
Advertisement
NexgenRx Inc.'s (CVE:NXG) Stock On An Uptrend: Could Fundamentals Be Driving The Momentum?
NexgenRx (CVE:NXG) has had a great run on the share market with its stock up by a significant 16% over the last three months. As most would know, fundamentals are what usually guide market price movements over the long-term, so we decided to look at the company's key financial indicators today to determine if they have any role to play in the recent price movement. In this article, we decided to focus on NexgenRx's ROE.
Return on equity or ROE is an important factor to be considered by a shareholder because it tells them how effectively their capital is being reinvested. Simply put, it is used to assess the profitability of a company in relation to its equity capital.
How Do You Calculate Return On Equity?
The formula for ROE is:
Return on Equity = Net Profit (from continuing operations) ÷ Shareholders' Equity
So, based on the above formula, the ROE for NexgenRx is:
12% = CA$1.0m ÷ CA$8.1m (Based on the trailing twelve months to June 2025).
The 'return' is the profit over the last twelve months. That means that for every CA$1 worth of shareholders' equity, the company generated CA$0.12 in profit.
See our latest analysis for NexgenRx
What Is The Relationship Between ROE And Earnings Growth?
Thus far, we have learned that ROE measures how efficiently a company is generating its profits. We now need to evaluate how much profit the company reinvests or "retains" for future growth which then gives us an idea about the growth potential of the company. Assuming all else is equal, companies that have both a higher return on equity and higher profit retention are usually the ones that have a higher growth rate when compared to companies that don't have the same features.
A Side By Side comparison of NexgenRx's Earnings Growth And 12% ROE
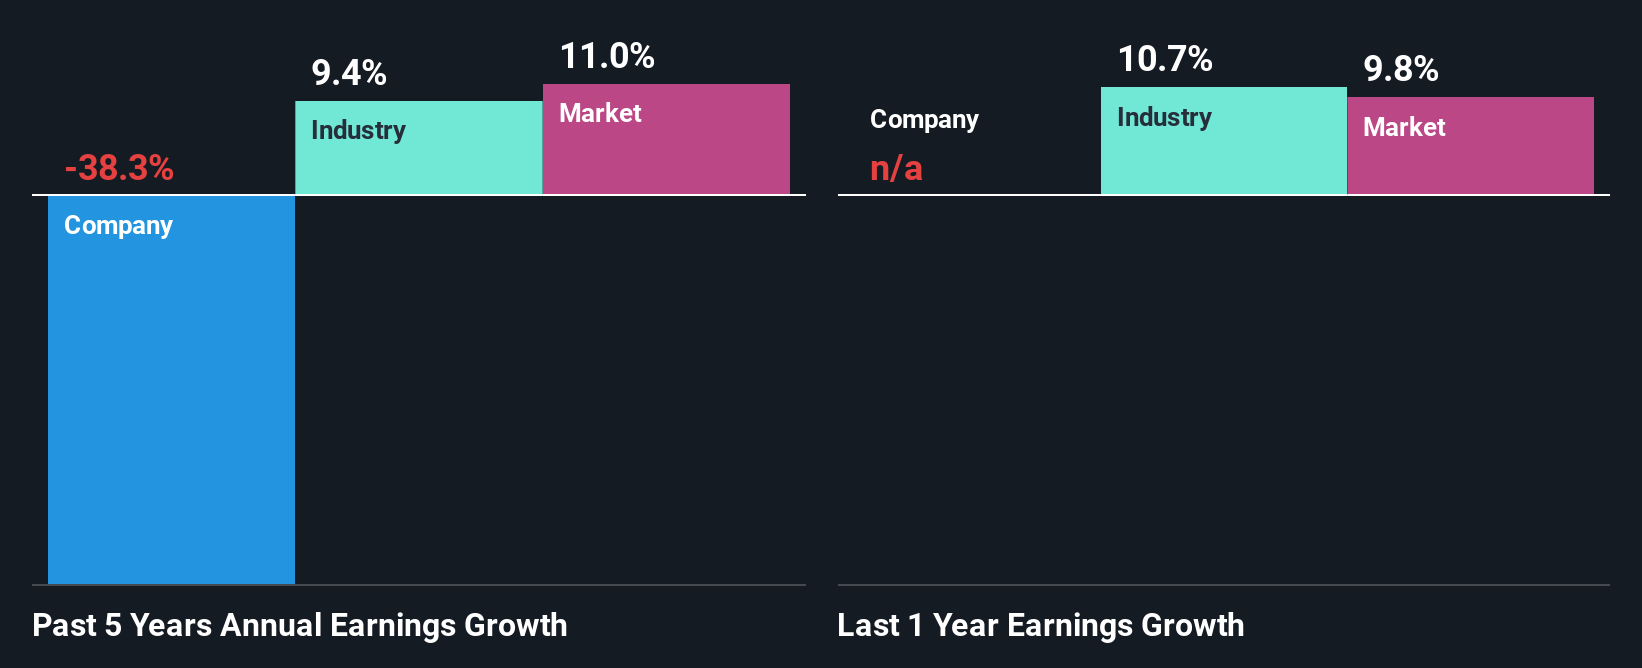
To begin with, NexgenRx seems to have a respectable ROE. And on comparing with the industry, we found that the the average industry ROE is similar at 13%. As you might expect, the 38% net income decline reported by NexgenRx is a bit of a surprise. We reckon that there could be some other factors at play here that are preventing the company's growth. Such as, the company pays out a huge portion of its earnings as dividends, or is faced with competitive pressures.
So, as a next step, we compared NexgenRx's performance against the industry and were disappointed to discover that while the company has been shrinking its earnings, the industry has been growing its earnings at a rate of 9.4% over the last few years.
The basis for attaching value to a company is, to a great extent, tied to its earnings growth. The investor should try to establish if the expected growth or decline in earnings, whichever the case may be, is priced in. By doing so, they will have an idea if the stock is headed into clear blue waters or if swampy waters await. If you're wondering about NexgenRx's's valuation, check out this gauge of its price-to-earnings ratio, as compared to its industry.
Is NexgenRx Making Efficient Use Of Its Profits?
With a high LTM (or last twelve month) payout ratio of 88% (implying that 12% of the profits are retained), most of NexgenRx's profits are being paid to shareholders, which explains the company's shrinking earnings. With only very little left to reinvest into the business, growth in earnings is far from likely. Our risks dashboard should have the 4 risks we have identified for NexgenRx.
Moreover, NexgenRx has been paying dividends for four years, which is a considerable amount of time, suggesting that management must have perceived that the shareholders prefer consistent dividends even though earnings have been shrinking.
Conclusion
In total, it does look like NexgenRx has some positive aspects to its business. However, while the company does have a high ROE, its earnings growth number is quite disappointing. This can be blamed on the fact that it reinvests only a small portion of its profits and pays out the rest as dividends. Until now, we have only just grazed the surface of the company's past performance by looking at the company's fundamentals. To gain further insights into NexgenRx's past profit growth, check out this visualization of past earnings, revenue and cash flows.
Valuation is complex, but we're here to simplify it.
Discover if NexgenRx might be undervalued or overvalued with our detailed analysis, featuring fair value estimates, potential risks, dividends, insider trades, and its financial condition.
Access Free AnalysisHave feedback on this article? Concerned about the content? Get in touch with us directly. Alternatively, email editorial-team (at) simplywallst.com.
This article by Simply Wall St is general in nature. We provide commentary based on historical data and analyst forecasts only using an unbiased methodology and our articles are not intended to be financial advice. It does not constitute a recommendation to buy or sell any stock, and does not take account of your objectives, or your financial situation. We aim to bring you long-term focused analysis driven by fundamental data. Note that our analysis may not factor in the latest price-sensitive company announcements or qualitative material. Simply Wall St has no position in any stocks mentioned.
About TSXV:NXG
NexgenRx
NexgenRx Inc. administers, adjudicates, and pays drug, dental, and other extended health-care claims for the beneficiaries of health benefit plans underwritten by its customers in Canada.
Flawless balance sheet with slight risk.
Market Insights

Advertisement
Community Narratives
The "Molecular Pencil": Why Beam's Technology is Built to Win
Fair Value US$65.01|65.4% undervalued
DA
Community Contributor
The silent giant behind virtually every advanced chip powering AI, smartphones, and modern infrastructure.
Fair Value US$310.00|6.1% undervalued
OS
Community Contributor
ADP Stock: Solid Fundamentals, But AI Investments Test Its Margin Resilience
Fair Value US$387.77|34.2% undervalued
YI
Community Contributor
MINISO's fair value is projected at 26.69 with an anticipated PE ratio shift of 20x
Fair Value US$24.03|9.6% undervalued
BE
Community Contributor