- Canada
- /
- Oil and Gas
- /
- TSX:SDE
75% earnings growth over 1 year has not materialized into gains for Spartan Delta (TSE:SDE) shareholders over that period


Even the best investor on earth makes unsuccessful investments. But it would be foolish to simply accept every extremely large loss as an inevitable part of the game. It must have been painful to be a Spartan Delta Corp. (TSE:SDE) shareholder over the last year, since the stock price plummeted 74% in that time. That'd be a striking reminder about the importance of diversification. Longer term investors have fared much better, since the share price is up 12% in three years. On top of that, the share price is down 19% in the last week.
Since Spartan Delta has shed CA$142m from its value in the past 7 days, let's see if the longer term decline has been driven by the business' economics.
Check out our latest analysis for Spartan Delta
While the efficient markets hypothesis continues to be taught by some, it has been proven that markets are over-reactive dynamic systems, and investors are not always rational. One way to examine how market sentiment has changed over time is to look at the interaction between a company's share price and its earnings per share (EPS).
During the unfortunate twelve months during which the Spartan Delta share price fell, it actually saw its earnings per share (EPS) improve by 75%. It could be that the share price was previously over-hyped.
It's fair to say that the share price does not seem to be reflecting the EPS growth. But we might find some different metrics explain the share price movements better.
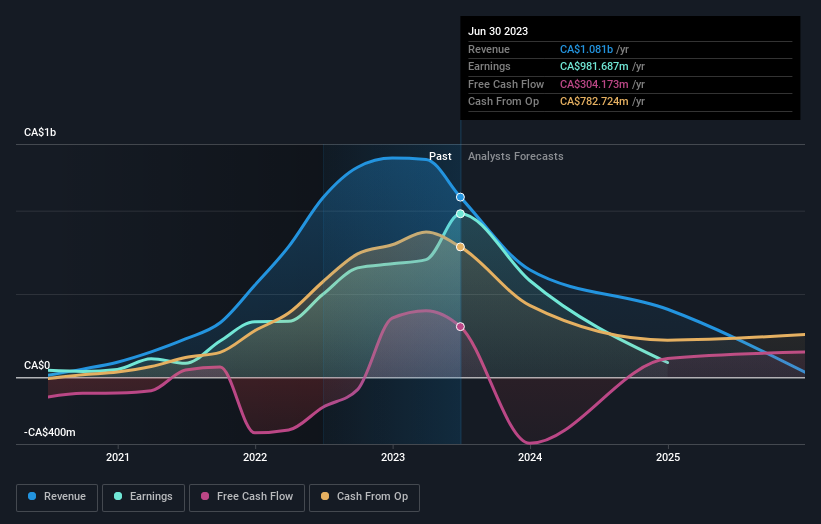
Revenue was pretty flat on last year, which isn't too bad. But the share price might be lower because the market expected a meaningful improvement, and got none.
You can see how earnings and revenue have changed over time in the image below (click on the chart to see the exact values).
We know that Spartan Delta has improved its bottom line over the last three years, but what does the future have in store? You can see how its balance sheet has strengthened (or weakened) over time in this free interactive graphic.
A Different Perspective
Investors in Spartan Delta had a tough year, with a total loss of 73%, against a market gain of about 2.2%. However, keep in mind that even the best stocks will sometimes underperform the market over a twelve month period. Unfortunately, last year's performance may indicate unresolved challenges, given that it was worse than the annualised loss of 1.5% over the last half decade. We realise that Baron Rothschild has said investors should "buy when there is blood on the streets", but we caution that investors should first be sure they are buying a high quality business. It's always interesting to track share price performance over the longer term. But to understand Spartan Delta better, we need to consider many other factors. Consider for instance, the ever-present spectre of investment risk. We've identified 3 warning signs with Spartan Delta (at least 1 which is significant) , and understanding them should be part of your investment process.
If you would prefer to check out another company -- one with potentially superior financials -- then do not miss this free list of companies that have proven they can grow earnings.
Please note, the market returns quoted in this article reflect the market weighted average returns of stocks that currently trade on Canadian exchanges.
New: Manage All Your Stock Portfolios in One Place
We've created the ultimate portfolio companion for stock investors, and it's free.
• Connect an unlimited number of Portfolios and see your total in one currency
• Be alerted to new Warning Signs or Risks via email or mobile
• Track the Fair Value of your stocks
Have feedback on this article? Concerned about the content? Get in touch with us directly. Alternatively, email editorial-team (at) simplywallst.com.
This article by Simply Wall St is general in nature. We provide commentary based on historical data and analyst forecasts only using an unbiased methodology and our articles are not intended to be financial advice. It does not constitute a recommendation to buy or sell any stock, and does not take account of your objectives, or your financial situation. We aim to bring you long-term focused analysis driven by fundamental data. Note that our analysis may not factor in the latest price-sensitive company announcements or qualitative material. Simply Wall St has no position in any stocks mentioned.
About TSX:SDE
Spartan Delta
Engages in the exploration, development, and production of oil and natural gas reserves in the Western Canada.
Undervalued with excellent balance sheet.
