Stock Analysis
- Canada
- /
- Energy Services
- /
- TSX:EFX
Enerflex (TSE:EFX shareholders incur further losses as stock declines 7.4% this week, taking five-year losses to 54%


Enerflex Ltd. (TSE:EFX) shareholders should be happy to see the share price up 16% in the last quarter. But that can't change the reality that over the longer term (five years), the returns have been really quite dismal. Indeed, the share price is down 58% in the period. So we're not so sure if the recent bounce should be celebrated. However, in the best case scenario (far from fait accompli), this improved performance might be sustained.
After losing 7.4% this past week, it's worth investigating the company's fundamentals to see what we can infer from past performance.
See our latest analysis for Enerflex
In his essay The Superinvestors of Graham-and-Doddsville Warren Buffett described how share prices do not always rationally reflect the value of a business. One imperfect but simple way to consider how the market perception of a company has shifted is to compare the change in the earnings per share (EPS) with the share price movement.
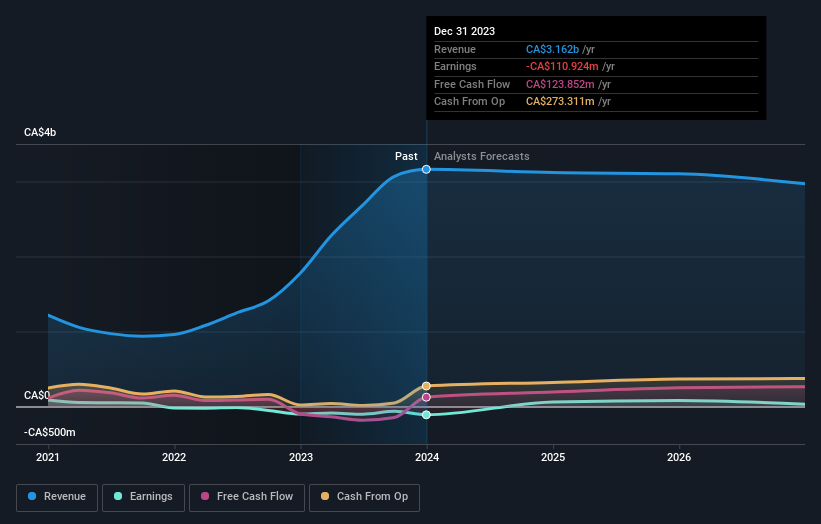
Enerflex has made a profit in the past. However, it made a loss in the last twelve months, suggesting profit may be an unreliable metric at this stage. Other metrics may better explain the share price move.
We don't think that the 1.3% is big factor in the share price, since it's quite small, as dividends go. In contrast to the share price, revenue has actually increased by 7.9% a year in the five year period. So it seems one might have to take closer look at the fundamentals to understand why the share price languishes. After all, there may be an opportunity.
You can see below how earnings and revenue have changed over time (discover the exact values by clicking on the image).
We consider it positive that insiders have made significant purchases in the last year. Even so, future earnings will be far more important to whether current shareholders make money. You can see what analysts are predicting for Enerflex in this interactive graph of future profit estimates.
What About Dividends?
As well as measuring the share price return, investors should also consider the total shareholder return (TSR). The TSR is a return calculation that accounts for the value of cash dividends (assuming that any dividend received was reinvested) and the calculated value of any discounted capital raisings and spin-offs. So for companies that pay a generous dividend, the TSR is often a lot higher than the share price return. We note that for Enerflex the TSR over the last 5 years was -54%, which is better than the share price return mentioned above. This is largely a result of its dividend payments!
A Different Perspective
Enerflex shareholders are up 0.6% for the year (even including dividends). But that was short of the market average. But at least that's still a gain! Over five years the TSR has been a reduction of 9% per year, over five years. It could well be that the business is stabilizing. I find it very interesting to look at share price over the long term as a proxy for business performance. But to truly gain insight, we need to consider other information, too. Even so, be aware that Enerflex is showing 1 warning sign in our investment analysis , you should know about...
Enerflex is not the only stock insiders are buying. So take a peek at this free list of growing companies with insider buying.
Please note, the market returns quoted in this article reflect the market weighted average returns of stocks that currently trade on Canadian exchanges.
Valuation is complex, but we're helping make it simple.
Find out whether Enerflex is potentially over or undervalued by checking out our comprehensive analysis, which includes fair value estimates, risks and warnings, dividends, insider transactions and financial health.
View the Free AnalysisHave feedback on this article? Concerned about the content? Get in touch with us directly. Alternatively, email editorial-team (at) simplywallst.com.
This article by Simply Wall St is general in nature. We provide commentary based on historical data and analyst forecasts only using an unbiased methodology and our articles are not intended to be financial advice. It does not constitute a recommendation to buy or sell any stock, and does not take account of your objectives, or your financial situation. We aim to bring you long-term focused analysis driven by fundamental data. Note that our analysis may not factor in the latest price-sensitive company announcements or qualitative material. Simply Wall St has no position in any stocks mentioned.
About TSX:EFX
Enerflex
Enerflex Ltd. offers energy infrastructure and energy transition solutions to natural gas markets in North America, Latin America, and the Eastern Hemisphere.
Very undervalued with moderate growth potential.
