- Canada
- /
- Construction
- /
- TSX:WSP
Investing in WSP Global (TSE:WSP) five years ago would have delivered you a 226% gain


When you buy shares in a company, it's worth keeping in mind the possibility that it could fail, and you could lose your money. But on the bright side, you can make far more than 100% on a really good stock. Long term WSP Global Inc. (TSE:WSP) shareholders would be well aware of this, since the stock is up 207% in five years. Also pleasing for shareholders was the 10% gain in the last three months.
So let's assess the underlying fundamentals over the last 5 years and see if they've moved in lock-step with shareholder returns.
View our latest analysis for WSP Global
To paraphrase Benjamin Graham: Over the short term the market is a voting machine, but over the long term it's a weighing machine. One flawed but reasonable way to assess how sentiment around a company has changed is to compare the earnings per share (EPS) with the share price.
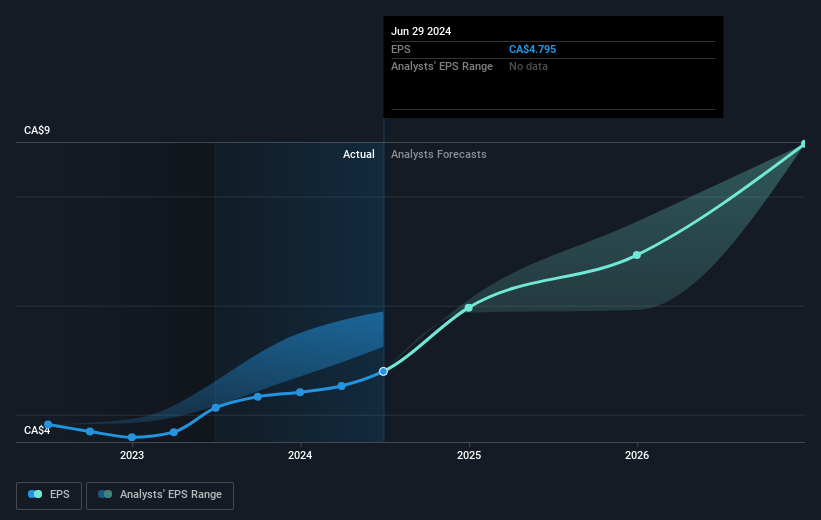
During five years of share price growth, WSP Global achieved compound earnings per share (EPS) growth of 12% per year. This EPS growth is lower than the 25% average annual increase in the share price. So it's fair to assume the market has a higher opinion of the business than it did five years ago. And that's hardly shocking given the track record of growth. This favorable sentiment is reflected in its (fairly optimistic) P/E ratio of 46.87.
The graphic below depicts how EPS has changed over time (unveil the exact values by clicking on the image).
We know that WSP Global has improved its bottom line lately, but is it going to grow revenue? Check if analysts think WSP Global will grow revenue in the future.
What About Dividends?
It is important to consider the total shareholder return, as well as the share price return, for any given stock. The TSR is a return calculation that accounts for the value of cash dividends (assuming that any dividend received was reinvested) and the calculated value of any discounted capital raisings and spin-offs. It's fair to say that the TSR gives a more complete picture for stocks that pay a dividend. We note that for WSP Global the TSR over the last 5 years was 226%, which is better than the share price return mentioned above. The dividends paid by the company have thusly boosted the total shareholder return.
A Different Perspective
It's nice to see that WSP Global shareholders have received a total shareholder return of 18% over the last year. Of course, that includes the dividend. However, the TSR over five years, coming in at 27% per year, is even more impressive. The pessimistic view would be that be that the stock has its best days behind it, but on the other hand the price might simply be moderating while the business itself continues to execute. It's always interesting to track share price performance over the longer term. But to understand WSP Global better, we need to consider many other factors. For instance, we've identified 1 warning sign for WSP Global that you should be aware of.
We will like WSP Global better if we see some big insider buys. While we wait, check out this free list of undervalued stocks (mostly small caps) with considerable, recent, insider buying.
Please note, the market returns quoted in this article reflect the market weighted average returns of stocks that currently trade on Canadian exchanges.
Valuation is complex, but we're here to simplify it.
Discover if WSP Global might be undervalued or overvalued with our detailed analysis, featuring fair value estimates, potential risks, dividends, insider trades, and its financial condition.
Access Free AnalysisHave feedback on this article? Concerned about the content? Get in touch with us directly. Alternatively, email editorial-team (at) simplywallst.com.
This article by Simply Wall St is general in nature. We provide commentary based on historical data and analyst forecasts only using an unbiased methodology and our articles are not intended to be financial advice. It does not constitute a recommendation to buy or sell any stock, and does not take account of your objectives, or your financial situation. We aim to bring you long-term focused analysis driven by fundamental data. Note that our analysis may not factor in the latest price-sensitive company announcements or qualitative material. Simply Wall St has no position in any stocks mentioned.
About TSX:WSP
WSP Global
Operates as a professional services consulting firm in the United States, Canada, the United Kingdom, Sweden, Australia, and internationally.
Adequate balance sheet with moderate growth potential.
