Insiders the biggest winners as PBG S.A.'s (BVMF:PTBL3) market cap rises to R$963m


Key Insights
- Significant insider control over PBG implies vested interests in company growth
- A total of 10 investors have a majority stake in the company with 52% ownership
- Past performance of a company along with ownership data serve to give a strong idea about prospects for a business
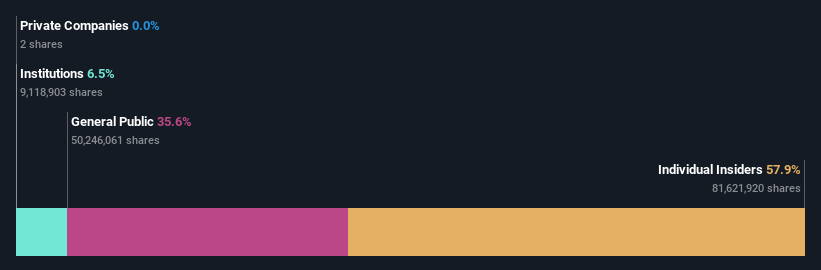
If you want to know who really controls PBG S.A. (BVMF:PTBL3), then you'll have to look at the makeup of its share registry. And the group that holds the biggest piece of the pie are individual insiders with 58% ownership. Put another way, the group faces the maximum upside potential (or downside risk).
As a result, insiders scored the highest last week as the company hit R$963m market cap following a 13% gain in the stock.
Let's delve deeper into each type of owner of PBG, beginning with the chart below.
See our latest analysis for PBG
What Does The Institutional Ownership Tell Us About PBG?
Institutional investors commonly compare their own returns to the returns of a commonly followed index. So they generally do consider buying larger companies that are included in the relevant benchmark index.
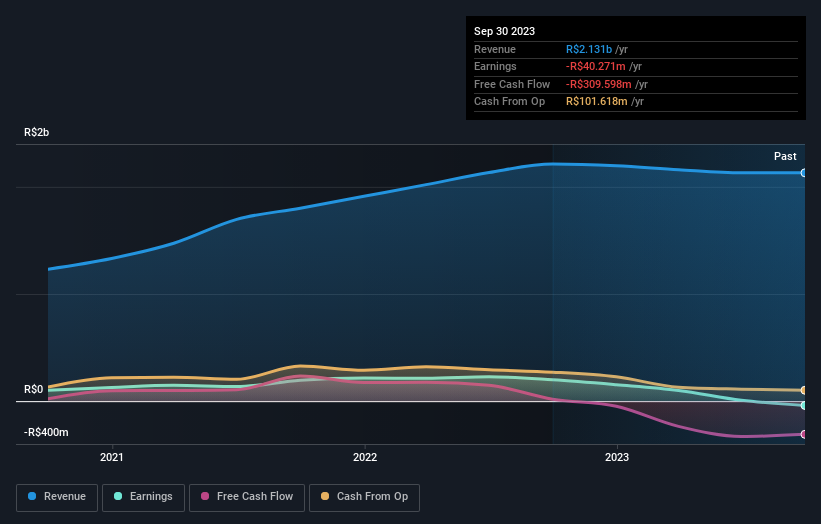
PBG already has institutions on the share registry. Indeed, they own a respectable stake in the company. This suggests some credibility amongst professional investors. But we can't rely on that fact alone since institutions make bad investments sometimes, just like everyone does. If multiple institutions change their view on a stock at the same time, you could see the share price drop fast. It's therefore worth looking at PBG's earnings history below. Of course, the future is what really matters.
PBG is not owned by hedge funds. Looking at our data, we can see that the largest shareholder is Cesar Gomes Junior with 19% of shares outstanding. Meanwhile, the second and third largest shareholders, hold 12% and 3.1%, of the shares outstanding, respectively.
We did some more digging and found that 10 of the top shareholders account for roughly 52% of the register, implying that along with larger shareholders, there are a few smaller shareholders, thereby balancing out each others interests somewhat.
While it makes sense to study institutional ownership data for a company, it also makes sense to study analyst sentiments to know which way the wind is blowing. Our information suggests that there isn't any analyst coverage of the stock, so it is probably little known.
Insider Ownership Of PBG
The definition of company insiders can be subjective and does vary between jurisdictions. Our data reflects individual insiders, capturing board members at the very least. The company management answer to the board and the latter should represent the interests of shareholders. Notably, sometimes top-level managers are on the board themselves.
I generally consider insider ownership to be a good thing. However, on some occasions it makes it more difficult for other shareholders to hold the board accountable for decisions.
It seems that insiders own more than half the PBG S.A. stock. This gives them a lot of power. Given it has a market cap of R$963m, that means they have R$557m worth of shares. It is good to see this level of investment. You can check here to see if those insiders have been buying recently.
General Public Ownership
The general public, who are usually individual investors, hold a 36% stake in PBG. While this group can't necessarily call the shots, it can certainly have a real influence on how the company is run.
Next Steps:
It's always worth thinking about the different groups who own shares in a company. But to understand PBG better, we need to consider many other factors. Take risks for example - PBG has 3 warning signs (and 1 which is a bit concerning) we think you should know about.
Of course, you might find a fantastic investment by looking elsewhere. So take a peek at this free list of interesting companies.
NB: Figures in this article are calculated using data from the last twelve months, which refer to the 12-month period ending on the last date of the month the financial statement is dated. This may not be consistent with full year annual report figures.
New: Manage All Your Stock Portfolios in One Place
We've created the ultimate portfolio companion for stock investors, and it's free.
• Connect an unlimited number of Portfolios and see your total in one currency
• Be alerted to new Warning Signs or Risks via email or mobile
• Track the Fair Value of your stocks
Have feedback on this article? Concerned about the content? Get in touch with us directly. Alternatively, email editorial-team (at) simplywallst.com.
This article by Simply Wall St is general in nature. We provide commentary based on historical data and analyst forecasts only using an unbiased methodology and our articles are not intended to be financial advice. It does not constitute a recommendation to buy or sell any stock, and does not take account of your objectives, or your financial situation. We aim to bring you long-term focused analysis driven by fundamental data. Note that our analysis may not factor in the latest price-sensitive company announcements or qualitative material. Simply Wall St has no position in any stocks mentioned.
About BOVESPA:PTBL3
PBG
Manufactures, exports, and sells ceramic and porcelain products in Brazil and internationally.
Slight second-rate dividend payer.
