- Belgium
- /
- Telecom Services and Carriers
- /
- ENXTBR:PROX
If You Had Bought Proximus' (EBR:PROX) Shares Five Years Ago You Would Be Down 48%


For many, the main point of investing is to generate higher returns than the overall market. But in any portfolio, there will be mixed results between individual stocks. At this point some shareholders may be questioning their investment in Proximus PLC (EBR:PROX), since the last five years saw the share price fall 48%. And some of the more recent buyers are probably worried, too, with the stock falling 36% in the last year. The falls have accelerated recently, with the share price down 19% in the last three months.
View our latest analysis for Proximus
To quote Buffett, 'Ships will sail around the world but the Flat Earth Society will flourish. There will continue to be wide discrepancies between price and value in the marketplace...' One flawed but reasonable way to assess how sentiment around a company has changed is to compare the earnings per share (EPS) with the share price.
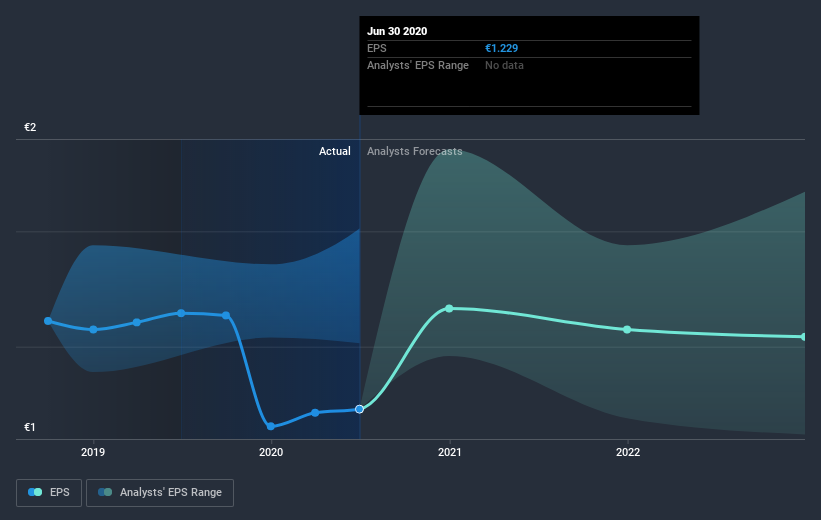
During the five years over which the share price declined, Proximus' earnings per share (EPS) dropped by 5.8% each year. Readers should note that the share price has fallen faster than the EPS, at a rate of 12% per year, over the period. So it seems the market was too confident about the business, in the past.
The graphic below depicts how EPS has changed over time (unveil the exact values by clicking on the image).
Dive deeper into Proximus' key metrics by checking this interactive graph of Proximus's earnings, revenue and cash flow.
What About Dividends?
It is important to consider the total shareholder return, as well as the share price return, for any given stock. The TSR is a return calculation that accounts for the value of cash dividends (assuming that any dividend received was reinvested) and the calculated value of any discounted capital raisings and spin-offs. So for companies that pay a generous dividend, the TSR is often a lot higher than the share price return. In the case of Proximus, it has a TSR of -37% for the last 5 years. That exceeds its share price return that we previously mentioned. This is largely a result of its dividend payments!
A Different Perspective
While the broader market lost about 18% in the twelve months, Proximus shareholders did even worse, losing 33% (even including dividends). However, it could simply be that the share price has been impacted by broader market jitters. It might be worth keeping an eye on the fundamentals, in case there's a good opportunity. Unfortunately, last year's performance may indicate unresolved challenges, given that it was worse than the annualised loss of 6.4% over the last half decade. We realise that Baron Rothschild has said investors should "buy when there is blood on the streets", but we caution that investors should first be sure they are buying a high quality business. It's always interesting to track share price performance over the longer term. But to understand Proximus better, we need to consider many other factors. Case in point: We've spotted 4 warning signs for Proximus you should be aware of, and 1 of them is concerning.
Of course, you might find a fantastic investment by looking elsewhere. So take a peek at this free list of companies we expect will grow earnings.
Please note, the market returns quoted in this article reflect the market weighted average returns of stocks that currently trade on BE exchanges.
When trading Proximus or any other investment, use the platform considered by many to be the Professional's Gateway to the Worlds Market, Interactive Brokers. You get the lowest-cost* trading on stocks, options, futures, forex, bonds and funds worldwide from a single integrated account. Promoted
New: Manage All Your Stock Portfolios in One Place
We've created the ultimate portfolio companion for stock investors, and it's free.
• Connect an unlimited number of Portfolios and see your total in one currency
• Be alerted to new Warning Signs or Risks via email or mobile
• Track the Fair Value of your stocks
This article by Simply Wall St is general in nature. It does not constitute a recommendation to buy or sell any stock, and does not take account of your objectives, or your financial situation. We aim to bring you long-term focused analysis driven by fundamental data. Note that our analysis may not factor in the latest price-sensitive company announcements or qualitative material. Simply Wall St has no position in any stocks mentioned.
*Interactive Brokers Rated Lowest Cost Broker by StockBrokers.com Annual Online Review 2020
Have feedback on this article? Concerned about the content? Get in touch with us directly. Alternatively, email editorial-team@simplywallst.com.
About ENXTBR:PROX
Proximus
Provides digital services and communication solutions in Belgium and internationally.
Low and slightly overvalued.

