Stock Analysis
- Belgium
- /
- Metals and Mining
- /
- ENXTBR:094426466
SCR-Sibelco's (EBR:094426466) earnings growth rate lags the 38% return delivered to shareholders

The simplest way to invest in stocks is to buy exchange traded funds. But one can do better than that by picking better than average stocks (as part of a diversified portfolio). To wit, the SCR-Sibelco N.V. (EBR:094426466) share price is 38% higher than it was a year ago, much better than the market return of around 4.3% (not including dividends) in the same period. That's a solid performance by our standards! Having said that, the longer term returns aren't so impressive, with stock gaining just 0.8% in three years.
While the stock has fallen 4.6% this week, it's worth focusing on the longer term and seeing if the stocks historical returns have been driven by the underlying fundamentals.
See our latest analysis for SCR-Sibelco
In his essay The Superinvestors of Graham-and-Doddsville Warren Buffett described how share prices do not always rationally reflect the value of a business. By comparing earnings per share (EPS) and share price changes over time, we can get a feel for how investor attitudes to a company have morphed over time.
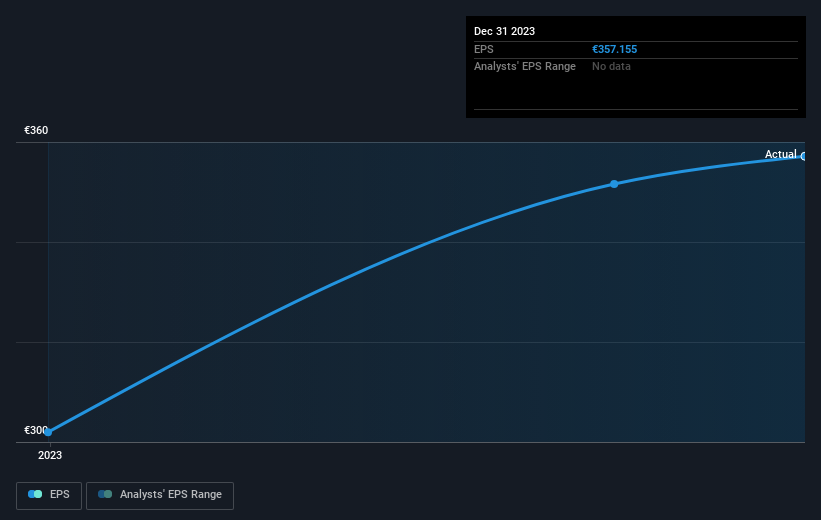
During the last year SCR-Sibelco grew its earnings per share (EPS) by 18%. This EPS growth is significantly lower than the 38% increase in the share price. This indicates that the market is now more optimistic about the stock.
You can see below how EPS has changed over time (discover the exact values by clicking on the image).
Dive deeper into SCR-Sibelco's key metrics by checking this interactive graph of SCR-Sibelco's earnings, revenue and cash flow.
A Different Perspective
We're pleased to report that SCR-Sibelco shareholders have received a total shareholder return of 38% over one year. Of course, that includes the dividend. There's no doubt those recent returns are much better than the TSR loss of 0.8% per year over five years. We generally put more weight on the long term performance over the short term, but the recent improvement could hint at a (positive) inflection point within the business. I find it very interesting to look at share price over the long term as a proxy for business performance. But to truly gain insight, we need to consider other information, too. To that end, you should be aware of the 1 warning sign we've spotted with SCR-Sibelco .
But note: SCR-Sibelco may not be the best stock to buy. So take a peek at this free list of interesting companies with past earnings growth (and further growth forecast).
Please note, the market returns quoted in this article reflect the market weighted average returns of stocks that currently trade on Belgian exchanges.
Valuation is complex, but we're helping make it simple.
Find out whether SCR-Sibelco is potentially over or undervalued by checking out our comprehensive analysis, which includes fair value estimates, risks and warnings, dividends, insider transactions and financial health.
View the Free AnalysisHave feedback on this article? Concerned about the content? Get in touch with us directly. Alternatively, email editorial-team (at) simplywallst.com.
This article by Simply Wall St is general in nature. We provide commentary based on historical data and analyst forecasts only using an unbiased methodology and our articles are not intended to be financial advice. It does not constitute a recommendation to buy or sell any stock, and does not take account of your objectives, or your financial situation. We aim to bring you long-term focused analysis driven by fundamental data. Note that our analysis may not factor in the latest price-sensitive company announcements or qualitative material. Simply Wall St has no position in any stocks mentioned.
About ENXTBR:094426466
SCR-Sibelco
Explores, develops, produces, and sells industrial minerals in Belgium and internationally.
Flawless balance sheet with proven track record.

