Stock Analysis
- Belgium
- /
- Construction
- /
- ENXTBR:DEME
DEME Group NV's (EBR:DEME) Stock is Soaring But Financials Seem Inconsistent: Will The Uptrend Continue?


Most readers would already be aware that DEME Group's (EBR:DEME) stock increased significantly by 42% over the past three months. But the company's key financial indicators appear to be differing across the board and that makes us question whether or not the company's current share price momentum can be maintained. Particularly, we will be paying attention to DEME Group's ROE today.
Return on Equity or ROE is a test of how effectively a company is growing its value and managing investors’ money. Simply put, it is used to assess the profitability of a company in relation to its equity capital.
Check out our latest analysis for DEME Group
How Do You Calculate Return On Equity?
The formula for ROE is:
Return on Equity = Net Profit (from continuing operations) ÷ Shareholders' Equity
So, based on the above formula, the ROE for DEME Group is:
8.8% = €172m ÷ €2.0b (Based on the trailing twelve months to December 2023).
The 'return' is the amount earned after tax over the last twelve months. Another way to think of that is that for every €1 worth of equity, the company was able to earn €0.09 in profit.
What Has ROE Got To Do With Earnings Growth?
We have already established that ROE serves as an efficient profit-generating gauge for a company's future earnings. Based on how much of its profits the company chooses to reinvest or "retain", we are then able to evaluate a company's future ability to generate profits. Generally speaking, other things being equal, firms with a high return on equity and profit retention, have a higher growth rate than firms that don’t share these attributes.
A Side By Side comparison of DEME Group's Earnings Growth And 8.8% ROE
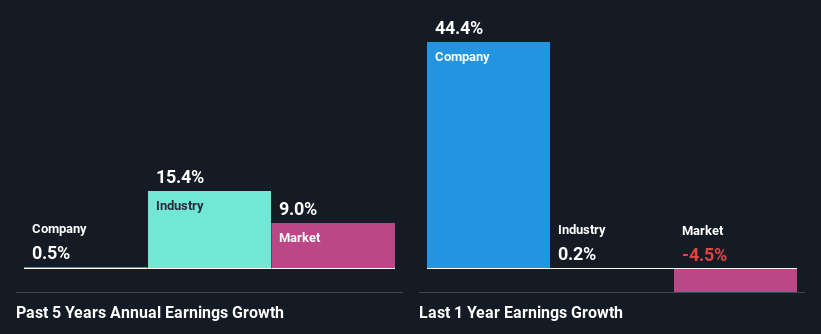
When you first look at it, DEME Group's ROE doesn't look that attractive. However, its ROE is similar to the industry average of 9.2%, so we won't completely dismiss the company. Still, DEME Group has seen a flat net income growth over the past five years. Remember, the company's ROE is not particularly great to begin with. So that could also be one of the reasons behind the company's flat growth in earnings.
Next, on comparing with the industry net income growth, we found that DEME Group's reported growth was lower than the industry growth of 15% over the last few years, which is not something we like to see.
Earnings growth is a huge factor in stock valuation. It’s important for an investor to know whether the market has priced in the company's expected earnings growth (or decline). This then helps them determine if the stock is placed for a bright or bleak future. Is DEME fairly valued? This infographic on the company's intrinsic value has everything you need to know.
Is DEME Group Making Efficient Use Of Its Profits?
Despite having a normal three-year median payout ratio of 36% (implying that the company keeps 64% of its income) over the last three years, DEME Group has seen a negligible amount of growth in earnings as we saw above. So there could be some other explanation in that regard. For instance, the company's business may be deteriorating.
In addition, DEME Group only recently started paying a dividend so the management must have decided the shareholders prefer dividends over earnings growth. Based on the latest analysts' estimates, we found that the company's future payout ratio over the next three years is expected to hold steady at 33%. Regardless, the future ROE for DEME Group is predicted to rise to 12% despite there being not much change expected in its payout ratio.
Summary
In total, we're a bit ambivalent about DEME Group's performance. Even though it appears to be retaining most of its profits, given the low ROE, investors may not be benefitting from all that reinvestment after all. The low earnings growth suggests our theory correct. That being so, the latest analyst forecasts show that the company will continue to see an expansion in its earnings. To know more about the latest analysts predictions for the company, check out this visualization of analyst forecasts for the company.
Valuation is complex, but we're helping make it simple.
Find out whether DEME Group is potentially over or undervalued by checking out our comprehensive analysis, which includes fair value estimates, risks and warnings, dividends, insider transactions and financial health.
View the Free AnalysisHave feedback on this article? Concerned about the content? Get in touch with us directly. Alternatively, email editorial-team (at) simplywallst.com.
This article by Simply Wall St is general in nature. We provide commentary based on historical data and analyst forecasts only using an unbiased methodology and our articles are not intended to be financial advice. It does not constitute a recommendation to buy or sell any stock, and does not take account of your objectives, or your financial situation. We aim to bring you long-term focused analysis driven by fundamental data. Note that our analysis may not factor in the latest price-sensitive company announcements or qualitative material. Simply Wall St has no position in any stocks mentioned.
About ENXTBR:DEME
DEME Group
Provides marine solutions in the fields of dredging, land reclamation, marine infrastructure, offshore energy, and environmental remediation.
Solid track record with excellent balance sheet.

