Stock Analysis
Most readers would already be aware that Etex's (EBR:094124453) stock increased significantly by 5.0% over the past week. Given that the market rewards strong financials in the long-term, we wonder if that is the case in this instance. In this article, we decided to focus on Etex's ROE.
Return on Equity or ROE is a test of how effectively a company is growing its value and managing investors’ money. In other words, it is a profitability ratio which measures the rate of return on the capital provided by the company's shareholders.
View our latest analysis for Etex
How Do You Calculate Return On Equity?
ROE can be calculated by using the formula:
Return on Equity = Net Profit (from continuing operations) ÷ Shareholders' Equity
So, based on the above formula, the ROE for Etex is:
15% = €288m ÷ €1.9b (Based on the trailing twelve months to June 2023).
The 'return' is the income the business earned over the last year. That means that for every €1 worth of shareholders' equity, the company generated €0.15 in profit.
What Is The Relationship Between ROE And Earnings Growth?
So far, we've learned that ROE is a measure of a company's profitability. Based on how much of its profits the company chooses to reinvest or "retain", we are then able to evaluate a company's future ability to generate profits. Generally speaking, other things being equal, firms with a high return on equity and profit retention, have a higher growth rate than firms that don’t share these attributes.
A Side By Side comparison of Etex's Earnings Growth And 15% ROE
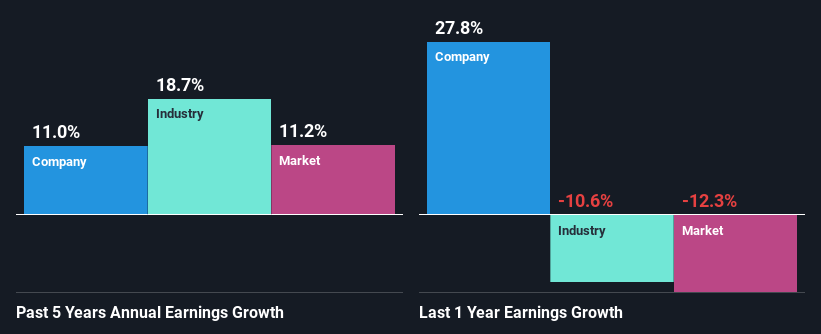
To start with, Etex's ROE looks acceptable. And on comparing with the industry, we found that the the average industry ROE is similar at 14%. This certainly adds some context to Etex's moderate 11% net income growth seen over the past five years.
Next, on comparing with the industry net income growth, we found that Etex's reported growth was lower than the industry growth of 19% over the last few years, which is not something we like to see.
Earnings growth is a huge factor in stock valuation. The investor should try to establish if the expected growth or decline in earnings, whichever the case may be, is priced in. Doing so will help them establish if the stock's future looks promising or ominous. One good indicator of expected earnings growth is the P/E ratio which determines the price the market is willing to pay for a stock based on its earnings prospects. So, you may want to check if Etex is trading on a high P/E or a low P/E, relative to its industry.
Is Etex Using Its Retained Earnings Effectively?
Etex has a three-year median payout ratio of 30%, which implies that it retains the remaining 70% of its profits. This suggests that its dividend is well covered, and given the decent growth seen by the company, it looks like management is reinvesting its earnings efficiently.
Moreover, Etex is determined to keep sharing its profits with shareholders which we infer from its long history of eight years of paying a dividend.
Conclusion
Overall, we are quite pleased with Etex's performance. In particular, it's great to see that the company is investing heavily into its business and along with a high rate of return, that has resulted in a respectable growth in its earnings. If the company continues to grow its earnings the way it has, that could have a positive impact on its share price given how earnings per share influence long-term share prices. Let's not forget, business risk is also one of the factors that affects the price of the stock. So this is also an important area that investors need to pay attention to before making a decision on any business. To know the 2 risks we have identified for Etex visit our risks dashboard for free.
Valuation is complex, but we're helping make it simple.
Find out whether Etex is potentially over or undervalued by checking out our comprehensive analysis, which includes fair value estimates, risks and warnings, dividends, insider transactions and financial health.
View the Free AnalysisHave feedback on this article? Concerned about the content? Get in touch with us directly. Alternatively, email editorial-team (at) simplywallst.com.
This article by Simply Wall St is general in nature. We provide commentary based on historical data and analyst forecasts only using an unbiased methodology and our articles are not intended to be financial advice. It does not constitute a recommendation to buy or sell any stock, and does not take account of your objectives, or your financial situation. We aim to bring you long-term focused analysis driven by fundamental data. Note that our analysis may not factor in the latest price-sensitive company announcements or qualitative material. Simply Wall St has no position in any stocks mentioned.
About ENXTBR:094124453
Etex
Etex N.V. manufactures and sells building materials in Benelux, Germany, the United Kingdom, France, other European countries, Italy, Spain, Germany, Benelux, Latina America, Australia, Africa, Asia, and internationally.
Good value with proven track record.

