
Advertisement
- Australia
- /
- Other Utilities
- /
- ASX:TPC
TPC Consolidated (ASX:TPC) stock performs better than its underlying earnings growth over last five years
We think all investors should try to buy and hold high quality multi-year winners. And highest quality companies can see their share prices grow by huge amounts. Don't believe it? Then look at the TPC Consolidated Limited (ASX:TPC) share price. It's 660% higher than it was five years ago. If that doesn't get you thinking about long term investing, we don't know what will. On top of that, the share price is up 73% in about a quarter. It really delights us to see such great share price performance for investors.
After a strong gain in the past week, it's worth seeing if longer term returns have been driven by improving fundamentals.
See our latest analysis for TPC Consolidated
To quote Buffett, 'Ships will sail around the world but the Flat Earth Society will flourish. There will continue to be wide discrepancies between price and value in the marketplace...' One imperfect but simple way to consider how the market perception of a company has shifted is to compare the change in the earnings per share (EPS) with the share price movement.
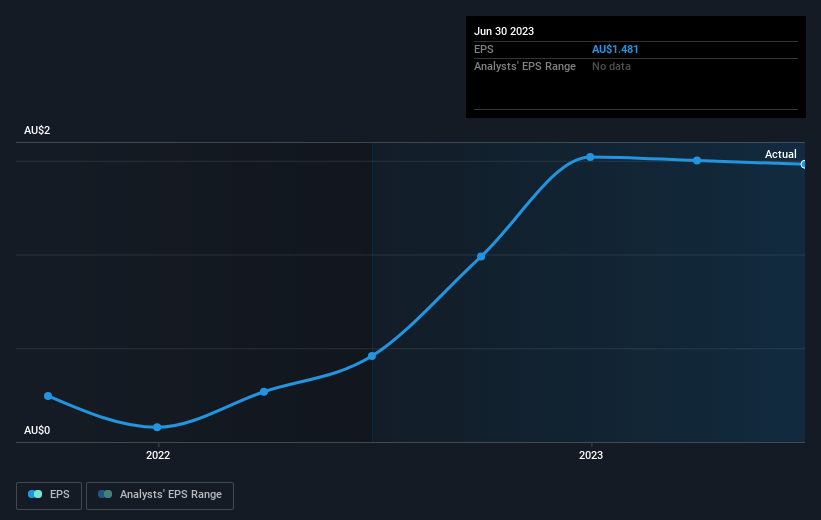
During five years of share price growth, TPC Consolidated achieved compound earnings per share (EPS) growth of 39% per year. This EPS growth is lower than the 50% average annual increase in the share price. This suggests that market participants hold the company in higher regard, these days. That's not necessarily surprising considering the five-year track record of earnings growth.
The graphic below depicts how EPS has changed over time (unveil the exact values by clicking on the image).
Before buying or selling a stock, we always recommend a close examination of historic growth trends, available here.
What About Dividends?
When looking at investment returns, it is important to consider the difference between total shareholder return (TSR) and share price return. The TSR incorporates the value of any spin-offs or discounted capital raisings, along with any dividends, based on the assumption that the dividends are reinvested. It's fair to say that the TSR gives a more complete picture for stocks that pay a dividend. We note that for TPC Consolidated the TSR over the last 5 years was 880%, which is better than the share price return mentioned above. The dividends paid by the company have thusly boosted the total shareholder return.
A Different Perspective
It's good to see that TPC Consolidated has rewarded shareholders with a total shareholder return of 190% in the last twelve months. And that does include the dividend. That gain is better than the annual TSR over five years, which is 58%. Therefore it seems like sentiment around the company has been positive lately. Given the share price momentum remains strong, it might be worth taking a closer look at the stock, lest you miss an opportunity. I find it very interesting to look at share price over the long term as a proxy for business performance. But to truly gain insight, we need to consider other information, too. Consider for instance, the ever-present spectre of investment risk. We've identified 3 warning signs with TPC Consolidated , and understanding them should be part of your investment process.
But note: TPC Consolidated may not be the best stock to buy. So take a peek at this free list of interesting companies with past earnings growth (and further growth forecast).
Please note, the market returns quoted in this article reflect the market weighted average returns of stocks that currently trade on Australian exchanges.
Valuation is complex, but we're here to simplify it.
Discover if TPC Consolidated might be undervalued or overvalued with our detailed analysis, featuring fair value estimates, potential risks, dividends, insider trades, and its financial condition.
Access Free AnalysisHave feedback on this article? Concerned about the content? Get in touch with us directly. Alternatively, email editorial-team (at) simplywallst.com.
This article by Simply Wall St is general in nature. We provide commentary based on historical data and analyst forecasts only using an unbiased methodology and our articles are not intended to be financial advice. It does not constitute a recommendation to buy or sell any stock, and does not take account of your objectives, or your financial situation. We aim to bring you long-term focused analysis driven by fundamental data. Note that our analysis may not factor in the latest price-sensitive company announcements or qualitative material. Simply Wall St has no position in any stocks mentioned.
About ASX:TPC
TPC Consolidated
Provides retail electricity and gas services to residential, commercial, and industrial customers in Australia.
Mediocre balance sheet with low risk.
Market Insights

Advertisement
Community Narratives
The company that turned a verb into a global necessity and basically runs the modern internet, digital ads, smartphones, maps, and AI.
Fair Value US$300.00|7.1% undervalued
OS
Community Contributor
Flowers Foods Pays A Fair Price For Health
Fair Value US$16.12|26.4% undervalued
NV
Community Contributor
TMX Group will thrive with 33.3% profit margin and enduring market moat
Fair Value CA$49.90|0.8% overvalued
LI
Community Contributor
The "Molecular Pencil": Why Beam's Technology is Built to Win
Fair Value US$65.01|65.8% undervalued
DA
Community Contributor