

This article is written for those who want to get better at using price to earnings ratios (P/E ratios). We'll show how you can use Lindsay Australia Limited's (ASX:LAU) P/E ratio to inform your assessment of the investment opportunity. Lindsay Australia has a P/E ratio of 12.15, based on the last twelve months. That is equivalent to an earnings yield of about 8.2%.
Check out our latest analysis for Lindsay Australia
How Do I Calculate A Price To Earnings Ratio?
The formula for P/E is:
Price to Earnings Ratio = Share Price ÷ Earnings per Share (EPS)
Or for Lindsay Australia:
P/E of 12.15 = A$0.36 ÷ A$0.03 (Based on the trailing twelve months to June 2019.)
Is A High Price-to-Earnings Ratio Good?
A higher P/E ratio implies that investors pay a higher price for the earning power of the business. That isn't a good or a bad thing on its own, but a high P/E means that buyers have a higher opinion of the business's prospects, relative to stocks with a lower P/E.
How Does Lindsay Australia's P/E Ratio Compare To Its Peers?
The P/E ratio indicates whether the market has higher or lower expectations of a company. If you look at the image below, you can see Lindsay Australia has a lower P/E than the average (16.1) in the transportation industry classification.
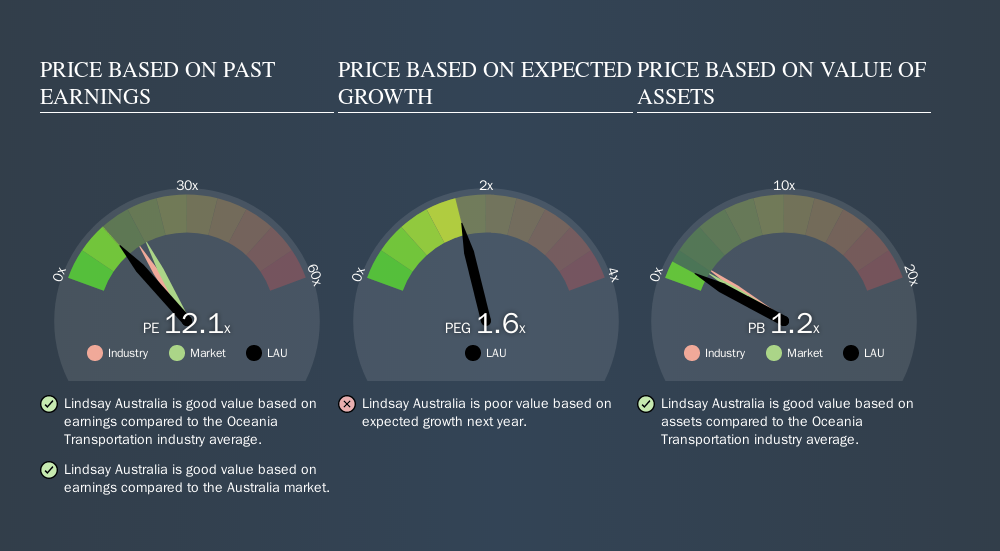
This suggests that market participants think Lindsay Australia will underperform other companies in its industry.
How Growth Rates Impact P/E Ratios
P/E ratios primarily reflect market expectations around earnings growth rates. When earnings grow, the 'E' increases, over time. That means unless the share price increases, the P/E will reduce in a few years. A lower P/E should indicate the stock is cheap relative to others -- and that may attract buyers.
Lindsay Australia's earnings per share grew by -9.3% in the last twelve months. And its annual EPS growth rate over 5 years is 1.3%. So if Lindsay Australia grows EPS going forward, that should be a positive for the share price. I would further inform my view by checking insider buying and selling., among other things.
Remember: P/E Ratios Don't Consider The Balance Sheet
It's important to note that the P/E ratio considers the market capitalization, not the enterprise value. Thus, the metric does not reflect cash or debt held by the company. Hypothetically, a company could reduce its future P/E ratio by spending its cash (or taking on debt) to achieve higher earnings.
Such spending might be good or bad, overall, but the key point here is that you need to look at debt to understand the P/E ratio in context.
So What Does Lindsay Australia's Balance Sheet Tell Us?
Lindsay Australia has net debt worth just 2.4% of its market capitalization. The market might award it a higher P/E ratio if it had net cash, but its unlikely this low level of net borrowing is having a big impact on the P/E multiple.
The Bottom Line On Lindsay Australia's P/E Ratio
Lindsay Australia has a P/E of 12.1. That's below the average in the AU market, which is 18.3. The company hasn't stretched its balance sheet, and earnings are improving. The P/E ratio implies the market is cautious about longer term prospects.
Investors have an opportunity when market expectations about a stock are wrong. If it is underestimating a company, investors can make money by buying and holding the shares until the market corrects itself. So this free visualization of the analyst consensus on future earnings could help you make the right decision about whether to buy, sell, or hold.
Of course you might be able to find a better stock than Lindsay Australia. So you may wish to see this free collection of other companies that have grown earnings strongly.
We aim to bring you long-term focused research analysis driven by fundamental data. Note that our analysis may not factor in the latest price-sensitive company announcements or qualitative material.
If you spot an error that warrants correction, please contact the editor at editorial-team@simplywallst.com. This article by Simply Wall St is general in nature. It does not constitute a recommendation to buy or sell any stock, and does not take account of your objectives, or your financial situation. Simply Wall St has no position in the stocks mentioned. Thank you for reading.
About ASX:LAU
Lindsay Australia
Provides integrated transport, logistics, and rural supply services to the food processing, food services, fresh produce, and horticulture sectors in Australia.
Undervalued with excellent balance sheet and pays a dividend.
