- Australia
- /
- Transportation
- /
- ASX:AZJ
Aurizon Holdings (ASX:AZJ) sheds AU$552m, company earnings and investor returns have been trending downwards for past five years


The main aim of stock picking is to find the market-beating stocks. But in any portfolio, there will be mixed results between individual stocks. At this point some shareholders may be questioning their investment in Aurizon Holdings Limited (ASX:AZJ), since the last five years saw the share price fall 43%. Furthermore, it's down 13% in about a quarter. That's not much fun for holders. This could be related to the recent financial results - you can catch up on the most recent data by reading our company report.
After losing 8.3% this past week, it's worth investigating the company's fundamentals to see what we can infer from past performance.
See our latest analysis for Aurizon Holdings
To paraphrase Benjamin Graham: Over the short term the market is a voting machine, but over the long term it's a weighing machine. One flawed but reasonable way to assess how sentiment around a company has changed is to compare the earnings per share (EPS) with the share price.
During the five years over which the share price declined, Aurizon Holdings' earnings per share (EPS) dropped by 1.5% each year. This reduction in EPS is less than the 11% annual reduction in the share price. So it seems the market was too confident about the business, in the past.
The company's earnings per share (over time) is depicted in the image below (click to see the exact numbers).
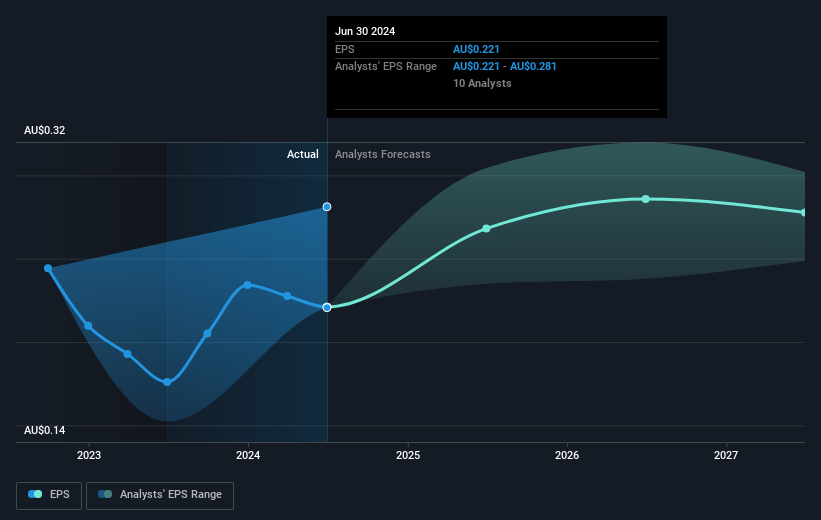
We know that Aurizon Holdings has improved its bottom line lately, but is it going to grow revenue? If you're interested, you could check this free report showing consensus revenue forecasts.
What About Dividends?
When looking at investment returns, it is important to consider the difference between total shareholder return (TSR) and share price return. The TSR incorporates the value of any spin-offs or discounted capital raisings, along with any dividends, based on the assumption that the dividends are reinvested. Arguably, the TSR gives a more comprehensive picture of the return generated by a stock. As it happens, Aurizon Holdings' TSR for the last 5 years was -25%, which exceeds the share price return mentioned earlier. And there's no prize for guessing that the dividend payments largely explain the divergence!
A Different Perspective
Investors in Aurizon Holdings had a tough year, with a total loss of 3.7% (including dividends), against a market gain of about 9.5%. Even the share prices of good stocks drop sometimes, but we want to see improvements in the fundamental metrics of a business, before getting too interested. However, the loss over the last year isn't as bad as the 5% per annum loss investors have suffered over the last half decade. We'd need to see some sustained improvements in the key metrics before we could muster much enthusiasm. I find it very interesting to look at share price over the long term as a proxy for business performance. But to truly gain insight, we need to consider other information, too. Like risks, for instance. Every company has them, and we've spotted 2 warning signs for Aurizon Holdings (of which 1 is significant!) you should know about.
Of course Aurizon Holdings may not be the best stock to buy. So you may wish to see this free collection of growth stocks.
Please note, the market returns quoted in this article reflect the market weighted average returns of stocks that currently trade on Australian exchanges.
New: Manage All Your Stock Portfolios in One Place
We've created the ultimate portfolio companion for stock investors, and it's free.
• Connect an unlimited number of Portfolios and see your total in one currency
• Be alerted to new Warning Signs or Risks via email or mobile
• Track the Fair Value of your stocks
Have feedback on this article? Concerned about the content? Get in touch with us directly. Alternatively, email editorial-team (at) simplywallst.com.
This article by Simply Wall St is general in nature. We provide commentary based on historical data and analyst forecasts only using an unbiased methodology and our articles are not intended to be financial advice. It does not constitute a recommendation to buy or sell any stock, and does not take account of your objectives, or your financial situation. We aim to bring you long-term focused analysis driven by fundamental data. Note that our analysis may not factor in the latest price-sensitive company announcements or qualitative material. Simply Wall St has no position in any stocks mentioned.
About ASX:AZJ
Aurizon Holdings
Through its subsidiaries, operates as a rail freight operator in Australia.
Good value with proven track record and pays a dividend.

